Free - Professional-Looking Executive Dashboard PPT Diagram

Free
Six-layer bullseye diagram executive dashboard with annotations on each layer, arranged symmetrically around the circle.
P.ID : 3872
    648 views
    135 Downloads
    Get Custom Slides by Experts
    Instantly Access Templates in PowerPoint

    Executive Dashboard PPT Template


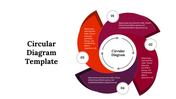
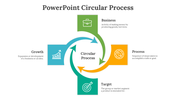
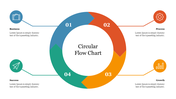
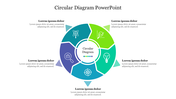
    Visualize how to turn complex data into engaging stories that inform, and empower your audience. Our executive dashboard PPT template helps you do just that.  Our templates provide a clear framework for displaying your data effectively, leaving your viewers with a lasting impression. The slide shows a Circular Loop of six-layers, each of which says, "Adapt to your needs and will capture the attention of everyone in the audience." These levels represent the steps in the process:

    1. Objective: Identify your specific audience for the dashboard.
    2. Audience: Understand the needs and wants of your audience.
    3. Data: Collect and organize data for the dashboard.
    4. Design: Create an attractive and informative dashboard.
    5. Content: Identifies and configures data to be displayed.
    6. Presentation: Decide how to present the dashboard to the audience.


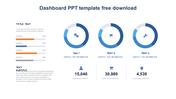
    This slide could be useful for the US. employees If you’re an experienced entrepreneur or marketing professional with reports and metrics, this template simplifies complex data. Use it in board meetings, client pictures, or internal reviews. Click below to download the executive dashboard PowerPoint templates & Google slides with accessibility features.


    Features of the template:


    • Slides are available in 4:3 & 16:9
    • Well-crafted template with instant download.
    • Get slides that are 100% customizable and easy to download!
    Advertisement

    You May Also Like These PowerPoint Templates

    Add to Wishlist
    Download
    AI Customize
    Circular infographic design with four green icons representing business, goals, growth, and finance, arranged around arrows.
    Free
    Add to Wishlist
    Download
    AI Customize
    Circular process flow diagram slide with five sections labeled Caption surrounding a central icon of three people.
    Add to Wishlist
    Download
    AI Customize
    Multisegment latest circular infographic paired with captions areas on the right, showcasing six distinct categories.
    Add to Wishlist
    Download
    AI Customize
    Colorful circular infographic with eight sections, each with an icon and text area, forming a closed loop layout.
    Free
    Add to Wishlist
    Download
    AI Customize
    Business plan slide displaying a pie chart with four sections, including icons and placeholders for titles and caption areas.
    Free
    Add to Wishlist
    Download
    AI Customize
    Circular arrow infographic slide with three colored arrows labeled 01 to 03, each with space for text descriptions.
    Free
    Add to Wishlist
    Download
    AI Customize
    Four green circular icons with numbers 01 to 04, linked by arrows, on a white background with text areas.
    Add to Wishlist
    Download
    AI Customize
    Infographic slide featuring a colorful pie chart with icons and sections for captions and placeholder text.
    Add to Wishlist
    Download
    AI Customize
    Circular infographic with interconnected orange and navy rings around a briefcase icon, each containing text.
    Add to Wishlist
    Download
    AI Customize
    Circular arrow process diagram slide with six colorful steps, each labeled with a number and caption.
    Free
    Add to Wishlist
    Download
    AI Customize
    Circular infographic slide with six sections for each with colored icons and descriptions.
    Add to Wishlist
    Download
    AI Customize
    Circular Management Framework PPT And Google Slides
    Add to Wishlist
    Download
    AI Customize
    Circular infographic PPT Google Slides with five color coded sections and business related icons with placeholder text.
    Add to Wishlist
    Download
    AI Customize
    Six Node Corporate Reputation Presentation Template
    Add to Wishlist
    Download
    AI Customize
    A causal loop diagram illustrating factors affecting deforestation, including many elements.
    Add to Wishlist
    Download
    AI Customize
    Circular infographic with six colorful sections in blue, teal, purple, green, orange, and, red, each with icon and text.
    Add to Wishlist
    Download
    AI Customize
    Three interconnected circular elements in blue, green, and teal, each with icons and text, on a white backrop.