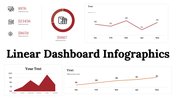
Editable Linear Dashboard Infographics PowerPoint Template

Pack of 36 slides
P.ID : 69026
Advertisement
1.1K+ views
260 Downloads
Get Custom Slides by Experts
Instantly Access Templates in PowerPoint

Infographics for a linear dashboard Budle PPT

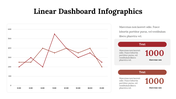
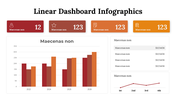
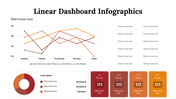
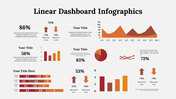
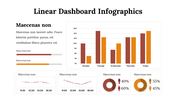
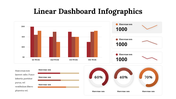
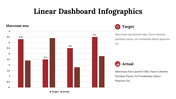
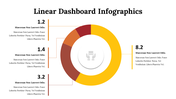
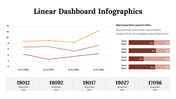
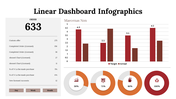
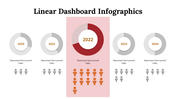
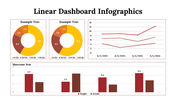
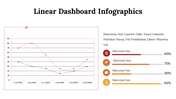
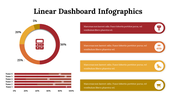
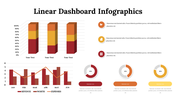
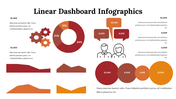
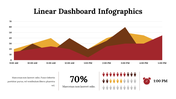
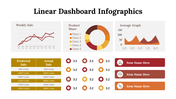
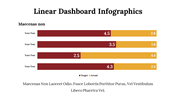
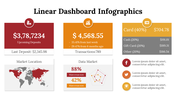
There is a large collection of templates in the Linear Dashboard Infographics PowerPoint Template Bundle that can be used to make presentations that are aesthetically engaging. For making graphs, charts, tables, and other business visualizations utilize these expert slides. The package is perfect for any kind of corporate presentation, whether it's for a small startup company or a big international firm.  More than 36 different slides and all the tools needed to make stunning visual presentations are included in the bundle. You can also look through our large selection of PPT business infographics, which can be easily customized with Google Slides and PPT to suit your needs. Just give it a shot!

Features of the Template

  • 100 % customizable slides and easy to download.
  • Slides are available in different colors
  • The slide has 4:3 and 16:9 formats.
  • Easy to change the slide colors quickly.
  • Appealing Presentation to impress an audience.
  • Create feature-rich slide presentations. 
  • An eye-pleasing color slide helps to give a catchy display.
  • Splendid dashboard bundle.

You May Also Like These PowerPoint Templates

Add to Wishlist
Download
AI Customize
Attractive Project Management Dashboard Slide Template
Free
Add to Wishlist
Download
AI Customize
Green radial gauge with a modern layout, surrounded by five labeled rectangular sections on a neutral background.
Add to Wishlist
Download
AI Customize
Colorful dashboard PPT slide with world map, pie charts, bar graphs, and metrics with placeholder text.
Add to Wishlist
Download
AI Customize
Use Dashboard PPT Template Slide Designs
Free
Add to Wishlist
Download
AI Customize
Dashboard template with three colorful gauge icons in the center and text boxes in green, blue, and gold.
Free
Add to Wishlist
Download
AI Customize
PowerPoint slide with a project dashboard showing two speedometers to represent project progress with captions.
Free
Add to Wishlist
Download
AI Customize
Dashboard PPT template featuring a speedometer with labeled sections like Direction, Objectives, Data, Business, and Study.
Add to Wishlist
Download
AI Customize
KPI template showing a bar chart with four cases, and two circular progress indicators in blue and orange showing percentage.
Add to Wishlist
Download
AI Customize
A slide displaying dashboard elements like bar graphs, a world map with data points, and progress bars, with captions.
Add to Wishlist
Download
AI Customize
Marketing KPI dashboard comparing Google, Facebook, and Bing ads, featuring clicks, cost, line charts, and campaign analysis.
Add to Wishlist
Download
AI Customize
Orange speedometer slide with a gauge showing 70% progress and space for caption text below.
Free
Add to Wishlist
Download
AI Customize
Tachometer PowerPoint slide featuring a colorful gauge with segments labeled with space for captions on a white backdrop.
Add to Wishlist
Download
AI Customize
Dashboard slide with metrics for social media, including followers, engagement, impressions, and reviews in charts.
Add to Wishlist
Download
AI Customize
Executive dashboard slide displaying colorful charts for executing dashboard to quality.
Add to Wishlist
Download
AI Customize
KPI PPT slide featuring circular progress indicators and a table of data values with captions on a white backdrop.
Add to Wishlist
Download
AI Customize
Sales KPI PPT slide featuring charts for Revenue, Revenue Comparison, New Customers, and Customer Acquisition Cost CAS.
Free
Add to Wishlist
Download
AI Customize
Dashboard slide with a world map highlighting countries, a bar chart showing statistics, and two percentage indicators.
Free
Add to Wishlist
Download
AI Customize
Five-level bar chart executive dashboard with colored blocks labeled with five levels, showing a gradual progression.
Add to Wishlist
Download
AI Customize
Our Predesigned KPI Presentation Template Slide Design
Add to Wishlist
Download
AI Customize
Modern dashboard PowerPoint template featuring circular progress charts, bar graphs, and key performance metrics.
Free
Add to Wishlist
Download
AI Customize
Bar chart comparing increases and decreases for movies like Avatar and Aquaman, with title logos below.
Add to Wishlist
Download
AI Customize
Speedometer dashboard PowerPoint slides showing three colored gauges with 25, 50, and 75 percent progress with captions.
Add to Wishlist
Download
AI Customize
Executive Dashboard slide showing key performance metrics such as revenue vs. target, customer acquisition, and CAC vs. CLV.
Free
Add to Wishlist
Download
AI Customize
Colorful project dashboard PPT slide showing a bar chart for four sections with a pie chart detailing percentages.
Add to Wishlist
Download
AI Customize
Central speedometer style gauge with red, yellow, blue, and green sections, surrounded by numbered text boxes.
Add to Wishlist
Download
AI Customize
KPI dashboard with a dual-line graph, balance performance gauge, and quarterly income metrics.
Add to Wishlist
Download
AI Customize
Business dashboard with progress indicators for promotion, channel management, and revenue metrics.