Creative Dashboard PowerPoint Templates And Google Slides Themes

 Canva
Canva
Creative Dashboard Presentation
Template
As they say, data don’t lie but sometimes data can confuse and muddle if not presented well. Our dashboard slide template simplifies difficult data and makes them attractive to viewers and readers in every way possible. Whether it is business metrics, project updates, or even general performance reports this template gives you a strong ally when conveying any message.
Benefits of using our Dashboard PowerPoint
Template
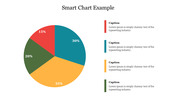
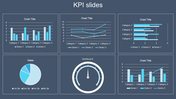
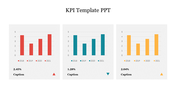
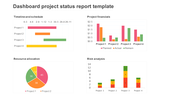
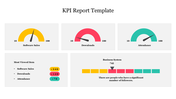
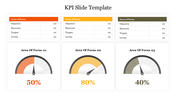
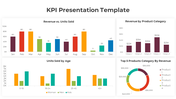
i) Our template is for business or analytical presentations, featuring three data visualizations:
- A green bar graph showing a rising trend from 2012-2017 with meters at 35%.
- A horizontal bar graph displaying fluctuating data from 2012-2017 with meters at 57%.
- An orange line graph highlighting an upward trend from 2012 to 2017 with meters at 70%.
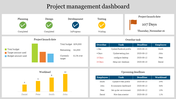
ii) This template is designed to present complex data in a clear and visually appealing manner. It helps in summarizing performance metrics and trends over time, making it easier for the audience to grasp key insights quickly.
iii) This template will be apt for business professionals, analysts, managers, and educators.
iv) Our template helps in making data-driven decisions by clearly showing trends and performance levels.
Discover our dashboard PPT template and start creating visuals that truly connect with your audience!
Features of the template:
- Slides are available in 4:3 & 16:9
- Well-crafted template with instant download.
- Get slides that are 100% customizable and easy to download


You May Also Like These PowerPoint Templates
Add to Wishlist
Download
Edit


Add to Wishlist
Download
Edit

Add to Wishlist
Download
Edit

Add to Wishlist
Download
Edit


Add to Wishlist
Download
Edit

Add to Wishlist
Download
Edit

Add to Wishlist
Download
Edit

Add to Wishlist
Download
Edit

Add to Wishlist
Download
Edit

Add to Wishlist
Download
Edit

Add to Wishlist
Download
Edit

Add to Wishlist
Download
Edit

Add to Wishlist
Download
Edit

Add to Wishlist
Download
Edit

Add to Wishlist
Download
Edit
Add to Wishlist
Download
Edit

Add to Wishlist
Download
Edit
