Elegant Project Management Dashboard PPT & Google Slides

Project management dashboard with charts for budget, progress, risks, workload, and projected launch date and icons.
P.ID : 35523
    6.5K+ views
    695 Downloads
    Get Custom Slides by Experts
    Instantly Access Templates in PowerPoint

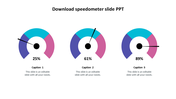
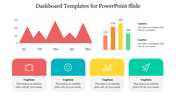
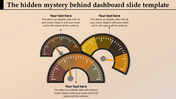
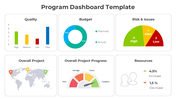
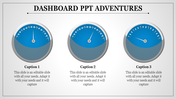
    Project Management Dashboard Presentation Slide 

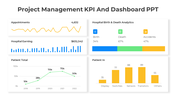
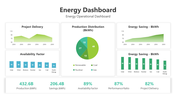
    Project management dashboard is a data visualization tool used to track and monitor the progress of a project. It provides an at-a-glance view of the key performance indicators (KPIs) that are important for decision-making and ensures that the project stays on track. The dashboard typically displays data related to project timelines, budgets, resource allocation, risks, and issues, all in one place. It is a handy tool for project managers to make informed decisions quickly and ensure that stakeholders are kept up to date on the status of the project.

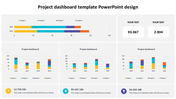
    You can feel free to utilize our template to present real-time insights into the project's performance. Also to display and identify and address potential issues before they become critical, allowing for timely corrective action. Moreover, it enables a bird's eye view of the progress of the project, ensuring transparency and accountability.


    Features of the template

    • 100% customizable slides and easy to download.
    • Slides are available in different nodes & colors.
    • The slide contains 16:9 and 4:3 formats.
    • Easy to change the slide colors quickly.
    • Well-crafted template with an instant download facility. 
    • Access on both MS PowerPoint and Google Slides.
    • Numerous graphics added.
    Advertisement

    You May Also Like These PowerPoint Templates

    Add to Wishlist
    Download
    AI Customize
    Attractive Tachometer Presentation Template Designs
    Add to Wishlist
    Download
    AI Customize
    Attractive Tachometer PowerPoint Presentation Template
    Add to Wishlist
    Download
    AI Customize
    Vector illustration of a speedometer with colored section on a conveyor belt with placeholder text.
    Add to Wishlist
    Download
    AI Customize
    Three circular tachometer dials in blue, pink, and red, each displaying different percentage values with captions below.
    Add to Wishlist
    Download
    AI Customize
    Slide with two speedometer style gauge charts in green, red, and purple segments, displaying percentages.
    Add to Wishlist
    Download
    AI Customize
    Dashboard template with a world map showing highlighted regions, bar graphs, and financial data captions.
    Add to Wishlist
    Download
    AI Customize
    Three colored tachometer gauges in red, orange, and green, each paired with a caption areas beneath.
    Add to Wishlist
    Download
    AI Customize
    Yellow speedometer design with two semicircular gauges displaying percentages, each paired with captions.
    Add to Wishlist
    Download
    AI Customize
    Tachometer PowerPoint template with four stages featuring colorful gauges and caption areas on a white backdrop.
    Add to Wishlist
    Download
    AI Customize
    Project dashboard template with four speedometer charts representing different completion levels with placeholder text.
    Add to Wishlist
    Download
    AI Customize
    Infographic featuring two red semicircular speedometers with needles, displaying percentages, and captions below.
    Add to Wishlist
    Download
    AI Customize
    Purple themed dashboard slide featuring multiple charts and a text box for descriptive content.
    Add to Wishlist
    Download
    AI Customize
    Yellow speedometer graphic indicating 70%, with a gray needle pointing right and a caption area below.
    Add to Wishlist
    Download
    AI Customize
    Black circular speedometer gauge with a green needle, surrounded by six captions on a white background.
    Free
    Add to Wishlist
    Download
    AI Customize
    Circular speedometer infographic with a black needle, yellow progress arc, and distance markers, next to an text box.
    Add to Wishlist
    Download
    AI Customize
    Sales performance dashboard PowerPoint template with a line graph, pie chart, and percentage change analysis.
    Add to Wishlist
    Download
    AI Customize
    Speedometer PowerPoint template with yellow background showing a 70 percent reading, along with 50 and 60 percent gauges.