Free - Download Supply Chain KPI Free for PowerPoint, Google Slides & Canva
 Canva
Canva
Supply Chain Kpi — PowerPoint, Google Slides, and Canva Template
Spending hours building slides from scratch is time you don't have. A ready-made, fully editable template gets you to a polished presentation in minutes — not hours.
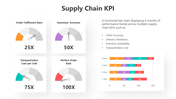
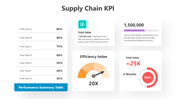
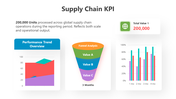
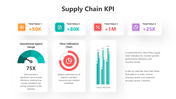
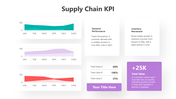
This Supply Chain KPI gives you a fully editable slide deck that's ready to use the moment you download it. The slide features supply Chain KPI slides with dials, charts, funnels, bars, and trend lines showing key metrics in colorful layouts. Drop it into your deck, replace the placeholder text, and you're done.
What's Inside
Multiple professionally designed slides — each one fully editable from text to icons to color scheme — text, colors, icons, and layout are all yours to adjust. Design variations include: Supply Chain KPI, Supply Chain, KPI, Supply Chain Performance Indicators. Match your brand, adapt the layout, change the colors — it takes minutes, not hours.
Who This Is For
Built for professionals, students, educators, and anyone who needs a polished, ready-to-use presentation template. No design background needed — just open, edit, and present.
Formats & Download
Available for PowerPoint, Google Slides, and Canva. Download free — no account needed. Open it in your preferred app and start editing right away.
Key Features
- Fully editable — text, colors, icons, and layout
- Compatible with PowerPoint, Google Slides, and Canva
- 16:9 widescreen format — presentation-ready
- Clean, professional design — no clutter
- Free — instant download access
Explore more KPI slide designs to find the right fit for your next presentation.


You May Also Like These PowerPoint Templates


