Attractive KPI Presentation PowerPoint Slide Designs

KPI slide with four semi circular gauges displaying metrics and overlapping colored circles showing numerical data.
P.ID : 46908
    1.1K+ views
    142 Downloads
    Get Custom Slides by Experts
    Instantly Access Templates in PowerPoint

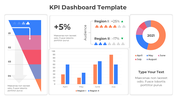
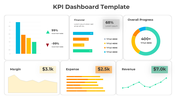
    Attractive KPI Presentation Slide For Presentation 

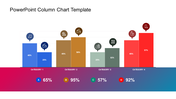
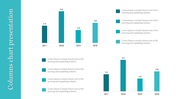
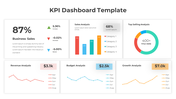
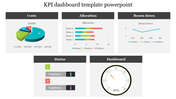
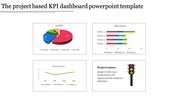
    How can you inspire your team to consider and accomplish the company's objectives? The thing is, KPI( Key Performance Indicator). A well-designed KPI PowerPoint template will help to motivate your team toward corporate objectives. At the same time, it will help them to get rid of time-sucking requests and remove inefficiencies. This is the tool you want, so we have added the best layout designs to achieve your business strategy. This slide is 100% customizable. The icons and pictures are designed with high-quality visuals. Grab our slide and reach the company objective on time. 


    Features of the template 

    • 100% customizable slides and easy to download.
    • Slides are available in different nodes & colors.
    • The slide contained 16:9 and 4:3 formats.
    • Easy to change the slide colors quickly.
    • It is a well-crafted template with an instant download facility.
    • Mind-blowing slide for the PowerPoint.
    • Best presentation slide
    Advertisement

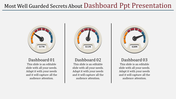
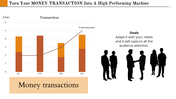
    You May Also Like These PowerPoint Templates

    Add to Wishlist
    Download
    AI Customize
    Project summary dashboard showing project statistics, budget, actual performance, and project performance by category.
    Add to Wishlist
    Download
    AI Customize
    Circular gauge template with sections in red, orange, yellow, green, and dark green, with captions on either side.
    Add to Wishlist
    Download
    AI Customize
    Infographic dashboard featuring a world map with COVID-19 case data, a gender-based death rate chart, and a pie chart.
    Add to Wishlist
    Download
    AI Customize
    Sashboard design featuring three plant species data and corresponding progress meters in red, green, and blue.
    Add to Wishlist
    Download
    AI Customize
    Green circular chart with five segments labeled by categories and percentages, with descriptions around it.
    Add to Wishlist
    Download
    AI Customize
    Chart PPT template showing 4 progress circles with percentages and color coded sections for Blue, Green, Yellow, and Orange.
    Free
    Add to Wishlist
    Download
    AI Customize
    An annual sales template with sections labeled Heading 1 to 5 and a pie chart illustrating various percentages with text.
    Free
    Add to Wishlist
    Download
    AI Customize
    Executive dashboard slide with five numbered circular icons on dark blue shapes, each labeled with key principles.
    Add to Wishlist
    Download
    AI Customize
    Dashboard layout with bar, pie, and stacked charts in yellow, orange, red, and green on a white background.
    Add to Wishlist
    Download
    AI Customize
    3D bar chart infographic showing four blocks in blue, green, red, and orange with percentages and captions.
    Free
    Add to Wishlist
    Download
    AI Customize
    Illustrative slide combining a pie chart with 45% in green and five silhouette icons to convey data distribution.
    Add to Wishlist
    Download
    AI Customize
    Infographic featuring pie graph, horizontal and vertical bar charts for visualizing data trends and comparisons.
    Free
    Add to Wishlist
    Download
    AI Customize
    Vertical bar chart with three purple bars increasing from 2019 to 2021, each labeled with percentages, and a businesswoman.
    Add to Wishlist
    Download
    AI Customize
    Executive slide showing expense meters, world sales performance, and bar graphs for margin, expenses, and revenue by month.
    Add to Wishlist
    Download
    AI Customize
    KPI template displaying financial metrics, including sales, profitability, liquidity, and leverage, with two gauge charts.
    Add to Wishlist
    Download
    AI Customize
    Executive dashboard slide with a pie chart, bar graph, area chart, and a profile section for job title and details.
    Add to Wishlist
    Download
    AI Customize
    KPI dashboard template PowerPoint slide featuring three sections for data visualization.
    Add to Wishlist
    Download
    AI Customize
    Central 3D pie chart with eight colorful segments, each linked to numbered captions placed around it.