Free - Editable KPI Dashboard PPT Presentation And Google Slides

Free
KPI dashboard layout with blue semicircle gauges and line charts representing social media performance metrics.
P.ID : 41710
    729 views
    270 Downloads
    Get Custom Slides by Experts
    Instantly Access Templates in PowerPoint

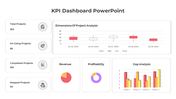
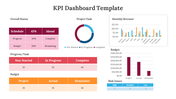
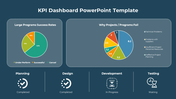
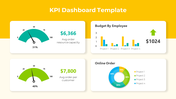
    Free KPI Dashboard PowerPoint Slide


    In today's data-driven business landscape, tracking and analyzing key performance indicators (KPIs) is crucial for informed decision-making and organizational success. A KPI dashboard serves as a centralized platform, consolidating essential metrics and performance indicators into a visually appealing display. It offers a real-time snapshot of various aspects of business performance, facilitating quick identification of trends, progress towards goals, and areas needing attention. this KPI dashboard PowerPoint template provides a comprehensive solution for creating impactful presentations that effectively communicate key metrics and insights. Designed for executives, managers, and analysts, this template offers customizable slides tailored to specific business requirements. With editable elements and pre-designed layouts, users can effortlessly showcase KPIs, analyze trends, and visualize data with clarity and precision. The template's user-friendly interface allows presenters to deliver engaging presentations that facilitate data-driven decision-making and drive organizational performance. Whether presenting to stakeholders, management teams, or investors, this template enables users to convey complex information in an accessible and compelling manner. With the ability to customize slides according to unique needs and objectives, our KPI Dashboard PowerPoint template empowers presenters to deliver impactful presentations that inspire action and drive business success. Download now and elevate your presentations with actionable insights and compelling visualizations.

    Features of the template


    • 100% customizable slides and easy to download.
    • The slide contains 16:9 and 4:3 formats.
    • Easy to change the colors of the slide quickly.
    • Highly compatible with PowerPoint and Google Slides.
    Advertisement

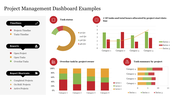
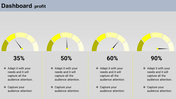
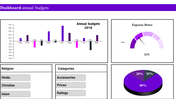
    You May Also Like These PowerPoint Templates

    Add to Wishlist
    Download
    AI Customize
    Stacked column chart with three categories, percentage labels, and circular step icons on both sides with percentage figures.
    Add to Wishlist
    Download
    AI Customize
    A stock chart with five vertical bars in orange and teal, representing financial data for a day period.
    Add to Wishlist
    Download
    AI Customize
    Line chart with labeled high and low points across a fluctuating path, illustrating peaks and troughs in data trends.
    Add to Wishlist
    Download
    AI Customize
    Line chart template with two lines and labeled data points, along with caption blocks on the left.
    Add to Wishlist
    Download
    AI Customize
    A line graph showing a plot structure with key points marked by colored dots, representing key stages.
    Add to Wishlist
    Download
    AI Customize
    SEO marketing plan template with icons representing different elements like e-commerce, email, and global marketing.
    Add to Wishlist
    Download
    AI Customize
    Slide deck showcasing various pie chart infographics in different colors and sections for data visualization.
    Free
    Add to Wishlist
    Download
    AI Customize
    Slide deck showcasing KWL chart layouts with colorful sections in purple, yellow, and teal, for structured insights.
    Add to Wishlist
    Download
    AI Customize
    Chart guide slide with two green-tone line graphs displaying data points, captions on the right, and a text footer.
    Free
    Add to Wishlist
    Download
    AI Customize
    Pie chart illustration showcasing five data segments in varying colors with percentage labels and connected captions areas.
    Add to Wishlist
    Download
    AI Customize
    Vertical Microsoft infographic with four colored arrows each labeled with icons for business, target, analytics, and money.
    Add to Wishlist
    Download
    AI Customize
    Steps to growth slide featuring a chart with four arrows indicating yearly growth percentages and a large text section.
    Free
    Add to Wishlist
    Download
    AI Customize
    Comparison bar chart showing percentage values from 2011 to 2019 for chat and security categories.
    Add to Wishlist
    Download
    AI Customize
    Infographic bar chart slide displaying daily comparisons for Business System and Supplier metrics.
    Add to Wishlist
    Download
    AI Customize
    Slide showcasing four circular progress charts with percentages in alternating teal and black accents.
    Add to Wishlist
    Download
    AI Customize
    Comparison chart with horizontal green bars displaying data for four examples across three series.
    Add to Wishlist
    Download
    AI Customize
    Pie chart highlighting percentages for four steps with a caption areas in a circular layout placed in a grey backdrop.
    Free
    Add to Wishlist
    Download
    AI Customize
    A slide showing a colorful KWL chart with sections for knowledge, inquiry, and learning outcomes with placeholder text.
    Free
    Add to Wishlist
    Download
    AI Customize
    Pie chart presentation slide showing three charts with percentages with text placeholders.