Free - KPI Dashboard PPT Template Presentation & Google Slides

Free
Slide featuring a bar graph and line chart showing monthly money transactions, alongside silhouettes of people shaking hands.
P.ID : 2114
    2.5K+ views
    423 Downloads
    Get Custom Slides by Experts
    Instantly Access Templates in PowerPoint

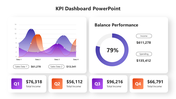
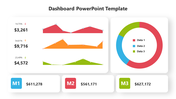
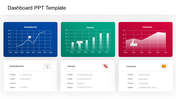
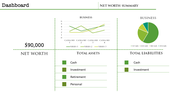
    Amazing KPI Dashboard Presentation Slide

    According to a survey, 60% of companies consider Key Performance Indicators (KPIs) to be a critical factor in measuring business performance. A KPI Dashboard for money transactions can help businesses monitor and analyze financial data, identify trends, and make informed decisions. A professionally designed template can help you create a visually appealing and comprehensive dashboard that presents key financial data in an easy-to-understand format. Using a customizable template can save you time and effort while creating a presentation that effectively communicates the financial health of your business.

    Features of the template:

    • 100% customizable slide and easy to download.
    • The slide contained 16:9 and 4:3 formats.
    • Well-crafted template with an instant download facility.
    • Highly Compatible with PowerPoint and Google Slide.
    • This slide has a colorful design pattern.
    • Easy to change the slide's colors.

    Advertisement

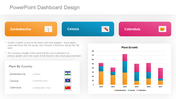
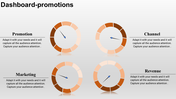
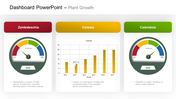
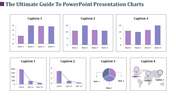
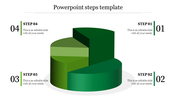
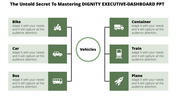
    You May Also Like These PowerPoint Templates

    Free
    Add to Wishlist
    Download
    AI Customize
    Annual report slide with orange bar graphs showing percentage growth from 2014 to 2021, paired with captions on the left.
    Add to Wishlist
    Download
    AI Customize
    KPI dashboard featuring a funnel chart, audience metrics, bar graph, and a circular chart with 2021 data.
    Add to Wishlist
    Download
    AI Customize
    Infographic chart with a truck carrying five colorful blocks and percentage bars, using green, orange, and brown tones.
    Free
    Add to Wishlist
    Download
    AI Customize
    Executive dashboard template featuring six blue columns with titles and alternating light and dark blue text boxes.
    Add to Wishlist
    Download
    AI Customize
    KPI dashboard template with four gauges in blue, green, orange, and red, alongside a flowchart with colored boxes.
    Add to Wishlist
    Download
    AI Customize
    Colorful dashboard PPT template featuring financial figures, text placeholders, and a radar chart for visual data analysis.
    Free
    Add to Wishlist
    Download
    AI Customize
    Slide featuring a bar graph and line chart showing monthly money transactions, alongside silhouettes of people shaking hands.
    Free
    Add to Wishlist
    Download
    AI Customize
    PowerPoint template featuring a colorful dashboard with bar graphs, pie charts, progress rings, and a timeline for data.
    Add to Wishlist
    Download
    AI Customize
    Dashboard showing expense meters, global percentages on a map, and a bar chart visualizing data distribution.
    Free
    Add to Wishlist
    Download
    AI Customize
    Free KPI PPT Template For Presentation & Google Slides
    Free
    Add to Wishlist
    Download
    AI Customize
    Dashboard layout includes a line graph, pie chart, and three bar graphs, all colored in red, green, and blue.
    Free
    Add to Wishlist
    Download
    AI Customize
    KPI PPT Template with three colourful circular progress charts  showing percentages, growth indicators, and  bar charts.
    Add to Wishlist
    Download
    AI Customize
    KPI dashboard slide showing multiple charts, including bar, line, pie, and gauge charts with tracking business data.
    Free
    Add to Wishlist
    Download
    AI Customize
    KPI Template PPT Presentation Slide With Bar Chart
    Add to Wishlist
    Download
    AI Customize
    KPI report slide displaying software sales, downloads, and attendance metrics with speedometer gauges and growth indicators.
    Add to Wishlist
    Download
    AI Customize
    KPI slide highlighting essential business metrics alongside color coded sections for quick reference and analysis.