Get KPI Dashboard PowerPoint Template and Google Slides

Green themed diagram illustrating stages of analysis delivery, from data source to client reports and dashboards.
P.ID : 2146
    815 views
    35 Downloads
    Get Custom Slides by Experts
    Instantly Access Templates in PowerPoint

    Visualize Progress: KPI Dashboard PPT Template


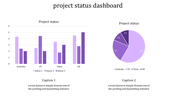
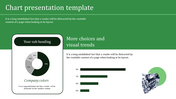
    Gain insights and track progress efficiently with our KPI Dashboard PowerPoint Template and Google Slides Themes. This template features a green-themed dashboard divided into four sections, equipped with all necessary elements to illustrate different stages. Tailored for managers, analysts, and executives, it facilitates the monitoring of key performance indicators and the identification of trends. Add your KPI data with our user-friendly design to create impactful presentations that drive decision-making. Whether analyzing sales, project milestones, or marketing campaigns, this versatile template ensures clarity and insight. Elevate your reporting and streamline performance management with our KPI template, your go-to solution for visualizing and optimizing business performance.

    Features of the template


    • 100% customizable slides are easy to download.
    • Slides are available in different colors.
    • The slide has 4:3 and 16:9 formats.
    • It is easy to change the slide colors quickly.
    • It has a cute design to impress an audience.
    • Create feature-rich, animated presentations.
    Advertisement

    You May Also Like These PowerPoint Templates

    Free
    Add to Wishlist
    Download
    AI Customize
    Pie chart slide with a blue and dark blue donut chart showing 75% sales, two numbered text boxes on the right.
    Free
    Add to Wishlist
    Download
    AI Customize
    Green and black area chart with a star shaped yellow badge and four circular icons with text below.
    Free
    Add to Wishlist
    Download
    AI Customize
    Creative infographic with a curved orange graph divided into four steps, each with an icon and label.
    Add to Wishlist
    Download
    AI Customize
    Bar chart with green hues, showing data for six categories, with side status boxes and light text.
    Add to Wishlist
    Download
    AI Customize
    Creative PowerPoint slide with two lines on a chart yellow and red with a green dot marking the highest point on the line.
    Free
    Add to Wishlist
    Download
    AI Customize
    Three column layout with blue megaphone, orange lightbulb, and red envelope icons on a beige background.
    Free
    Add to Wishlist
    Download
    AI Customize
    A simple chart slide with overlaid blue, green, orange, and yellow circles of varying sizes with a graph and captions.
    Add to Wishlist
    Download
    AI Customize
    Gantt chart PowerPoint template showing a timeline for multiple targets across January, February, and March, with milestones.
    Add to Wishlist
    Download
    AI Customize
    Bar chart slide showcasing yearly data from 2016 to 2021, with three distinct bar categories and values in shades of purple.
    Add to Wishlist
    Download
    AI Customize
    Bar chart slide with colorful conical graphs representing different categories, accompanied by labeled captions and icons.
    Add to Wishlist
    Download
    AI Customize
    3D cone chart with orange, pink, and blue segments, placed on a gray platform with a white background.
    Add to Wishlist
    Download
    AI Customize
    Bar chart slide showing the performance of four products with categories like sales growth, market share, and profit margin.
    Add to Wishlist
    Download
    AI Customize
    Slide displaying two pie charts with quarter wise performance data, along with performance percentages at the bottom.
    Add to Wishlist
    Download
    AI Customize
    Slide featuring a businessman pointing at a board with a pie chart and two circular progress visuals in red and yellow.
    Add to Wishlist
    Download
    AI Customize
    PowerPoint slide showcasing a chart with project status trends and a progress bar for each year.
    Add to Wishlist
    Download
    AI Customize
    Slide featuring three green pie charts and a line graph below, illustrating data trends for different categories.
    Add to Wishlist
    Download
    AI Customize
    Colorful timeline PowerPoint chart illustrating shifts for various employees throughout the day with peak hours highlighted.
    Free
    Add to Wishlist
    Download
    AI Customize
    Business plan infographic with a four-quadrant layout labeled with sales strategies and a 3D pie chart on the right.