Growth PowerPoint template with data Presentation slides

Pie charts showing data percentages for growth, with three percentage values with placeholder text.
P.ID : 12774
    376 views
    36 Downloads
    Get Custom Slides by Experts
    Instantly Access Templates in PowerPoint

    Growth PowerPoint template  and Google Slides


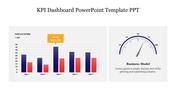
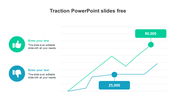
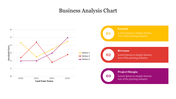
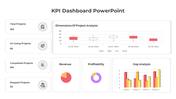
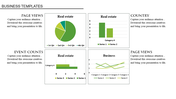
    The Multi-Chart Growth Template offers a comprehensive and visually engaging layout designed to showcase growth trends or comparisons across different datasets. This template features three distinct charts, each in a different color, with dedicated captions to highlight the information being presented. This format empowers you to effectively communicate growth patterns, trends, and comparisons in a clear and visually captivating way.

    This template is a valuable tool for business professionals, marketers, analysts, or anyone who needs to communicate complex growth data, trends, or comparisons in a clear and visually appealing way.

    Features of this template:


    • 100 % customizable slides are easy to download. 
    • Slides are available in different nodes and colors.
    • The slide was contained in 16:9 and 4:3 formats.
    • It is easy to change the slide colors quickly.
    • Well-crafted template with an instant download facility.
    • The clear layout of this template will help you design a professional-looking presentation.
    • The multi-color visuals on this slide will make your presentation eye-catching.
    Advertisement

    You May Also Like These PowerPoint Templates

    Add to Wishlist
    Download
    AI Customize
    Colorful progress bars in rows, showing numbered squares in red, teal, purple, and blue, with text on the right.
    Add to Wishlist
    Download
    AI Customize
    Professional setting with pie charts showing task distribution in red tones for analysis, collection, and development.
    Add to Wishlist
    Download
    AI Customize
    Project overview dashboard template with area chart, line charts for time intervals, and percentage indicators.
    Add to Wishlist
    Download
    AI Customize
    Gradient peaks showing sales growth percentages in shades of blue and gray, with detailed text on the right dark sidebar.
    Add to Wishlist
    Download
    AI Customize
    Slide featuring a blue-toned pie chart representing sales revenue percentages, with captions areas for each segment.
    Add to Wishlist
    Download
    AI Customize
    Row of pie charts with varying color schemes for data visualization each place diwth caption areas.
    Add to Wishlist
    Download
    AI Customize
    Dashboard chart displaying social media subscribers by gender, age, most read articles, and categories in 2019.
    Add to Wishlist
    Download
    AI Customize
    Three pie charts in red, yellow, and blue with percentage values, arranged horizontally with text below.
    Add to Wishlist
    Download
    AI Customize
    Six-month Gantt chart template spanning July to December 2020 with weekly divisions and task rows.
    Add to Wishlist
    Download
    AI Customize
    Chart showing blue bars representing growth metric alongside an orange line marking an ascending trend over eight categories.
    Add to Wishlist
    Download
    AI Customize
    Five segment pie chart in orange, blue, red, green, and pink, each with number and connected with text areas.
    Free
    Add to Wishlist
    Download
    AI Customize
    Line chart in teal showing data points from 2013 to 2020 on a white background, with five icons listed on the right.
    Free
    Add to Wishlist
    Download
    AI Customize
    Histogram on the left and Pareto chart in pink and orange with cumulative line on the right.
    Free
    Add to Wishlist
    Download
    AI Customize
    Four blue pyramid shapes in ascending size, labeled with percentages, aligned over a horizontal gray bar.
    Free
    Add to Wishlist
    Download
    AI Customize
    Dashboard with a timeline bar chart in green and purple, labeled with milestones for savings and investments.
    Add to Wishlist
    Download
    AI Customize
    A pie chart featuring five segments, each labeled with percentages, surrounded by text on a blue background.
    Add to Wishlist
    Download
    AI Customize
    Waterfall PowerPoint chart displaying increases and decreases for eight items with color coded bars for each change.
    Add to Wishlist
    Download
    AI Customize
    Horizontal bar graph slide with four colored steps and corresponding descriptions on the right.