• Home
  • Collections
  • Chart
  • Sales Growth Plan Powerpoint Presentation-The Ultimate Secret Of Sales Growth Plan- Power Point Presentation

Marketing Sales Growth Plan Powerpoint Presentation

Gradient peaks showing sales growth percentages in shades of blue and gray, with detailed text on the right dark sidebar.
P.ID : 4920
    358 views
    8 Downloads
    Get Custom Slides by Experts
    Instantly Access Templates in PowerPoint

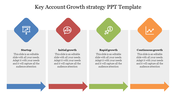
    Sales Growth Plan PowerPoint Template


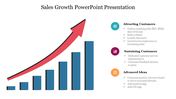
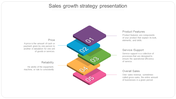
    Elevate the impact of your sales presentations with our sales growth plan PowerPoint template, designed specifically for professionals utilizing PowerPoint. This dynamic template is your gateway to crafting visually compelling slides that articulate strategic sales growth plans, enriched with impactful graphs and charts.


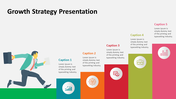
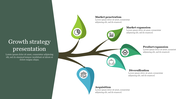
    With a modern design, it adeptly transforms intricate sales strategies into clear and engaging visuals. Tailored for sales teams, executives, and business leaders, it simplifies the process of creating impactful presentations for clients, stakeholders, or internal discussions.


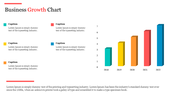
    Featuring a spacious layout for text, a graph diagram with a vibrant multi-color scheme, and a mixed background of black and white, this template provides a versatile canvas for your content.


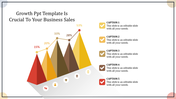
    Download our sales growth plan with Graph PowerPoint Template. Elevate your sales presentations, seamlessly transforming your strategies into visually compelling and data-backed narratives.


    Features of the template

    • 100% customizable slides and easy to download.
    • Slides are available in different nodes & colors.
    • The slide contains 16:9 and 4:3 formats.
    • It is easy to change the colors of the slide quickly.
    • Well-crafted template with an instant download facility. 
    Advertisement

    You May Also Like These PowerPoint Templates

    Free
    Add to Wishlist
    Download
    AI Customize
    Gantt chart plan template showing tasks across months with a colorful circular pie chart and matching bars on theright.
    Add to Wishlist
    Download
    AI Customize
    Financial highlights slide with bar chart and circular gauges tracking sales, operating income, and expenses.
    Add to Wishlist
    Download
    AI Customize
    Project schedule slide with a Gantt chart displaying tasks, timelines, and completion percentages.
    Free
    Add to Wishlist
    Download
    AI Customize
    Dashboard with line graphs, a circular chart with three segments, and labeled financial metrics, in red, orange, and green.
    Add to Wishlist
    Download
    AI Customize
    Dashboard slide showing Zantedeschia, Celosia, and Calendula growth data with a bar chart from 2012 to 2017.
    Add to Wishlist
    Download
    AI Customize
    A dashboard style slide showing plant growth data for Zantedeschia, Celosia, and Calendula with gauge charts and a bar graph.
    Free
    Add to Wishlist
    Download
    AI Customize
    Comparison of revenue and cost distributions with pie charts displaying CAPEX and OPEX percentages.
    Add to Wishlist
    Download
    AI Customize
    Funnel infographic with blue, red, yellow, and green sections, each with icons, connected to text descriptions.
    Free
    Add to Wishlist
    Download
    AI Customize
    Four vertical orange columns and percentages, labeled by year, along with a businesswoman illustration on the right.
    Add to Wishlist
    Download
    AI Customize
    Botanical data dashboard template  showing performance metrics for flower species, featuring line and bar charts.
    Add to Wishlist
    Download
    AI Customize
    PowerPoint slide with multiple chart types, including bar, line, and pie charts with different styles.
    Free
    Add to Wishlist
    Download
    AI Customize
    Chart with colorful bars representing yearly data from 2013 to 2020, paired with eight colorful cube icons on the sides.
    Add to Wishlist
    Download
    AI Customize
    KPI dashboard featuring a funnel chart, audience metrics, bar graph, and a circular chart with 2021 data.
    Add to Wishlist
    Download
    AI Customize
    Infographic chart with a truck carrying five colorful blocks and percentage bars, using green, orange, and brown tones.
    Free
    Add to Wishlist
    Download
    AI Customize
    A circular 3D chart in blue, green, purple, and orange representing yearly expansion categories and values.
    Free
    Add to Wishlist
    Download
    AI Customize
    Bar chart PowerPoint slides showcasing different business categories with colorful bars in different layout designs.
    Add to Wishlist
    Download
    AI Customize
    Chart infographic comparing data with orange and blue bars, alongside expense and budget details on the right.
    Add to Wishlist
    Download
    AI Customize
    Horizontal layout featuring five purple icons connected by a bar, with detailed text columns below each step.
    Free
    Add to Wishlist
    Download
    AI Customize
    A professional comparison slide featuring horizontal bar graphs displaying various percentages alongside captions with icons.
    Add to Wishlist
    Download
    AI Customize
    Company Annual Report slide featuring sections for overview, financial review, team management, and service offerings.