Website PowerPoint Dashboard Templates Designs

Dashboard template showing sales, orders, visitors, and users metrics with visual bar and pie charts for website analysis.
P.ID : 1858
    2K+ views
    186 Downloads
    Get Custom Slides by Experts
    Instantly Access Templates in PowerPoint

    Dashboard Presentation Slide


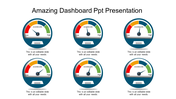
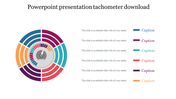
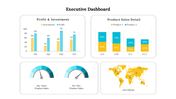
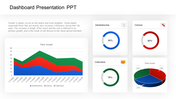
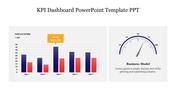
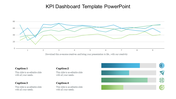
    Take advantage of our Dashboard Presentation Template to start a smooth data communication journey. Build a slide where pie charts and lines dance in line to tell a story that draws viewers in right away. Imagine that there are four nodes to the right, calling you to a place where you can quickly add photos, dashboards, emails, calendars, and other components. It's a graphic story created for professionals who want to simply communicate complex information.

    Put yourself in the position of decision-makers, analysts, and executives negotiating the complexity of data. This template acts as a compass to help you navigate a world filled with useful pie and line charts. The four nodes put the ability to customize your tale right at your fingertips, transforming your data into an engaging visual experience.

    Our Dashboard Presentation Template plays the lead role in this data immersion story, turning your presentations into engaging reports. Download our template to allow the power of simplicity and watch your data story come to life.


    Features of the Templates


    •  Completely adaptable.
    •  The slide show is in 4:3, 16:9, zip format.
    •  There is very strong connectivity with Google Slides and PowerPoint.
    •  It is simple and quick to alter the slide's color.
    •  An efficient template that can be easily accessed immediately.
    •  Easy to Download
    Advertisement

    You May Also Like These PowerPoint Templates

    Add to Wishlist
    Download
    AI Customize
    Microsoft PowerPoint slide featuring three donut charts in yellow, orange, and pink, each with different percentage values.
    Add to Wishlist
    Download
    AI Customize
    Speedometer template with four gauges displaying percentages: blue at 70%, orange at 50%, dark red at 55%, and red at 85%.
    Add to Wishlist
    Download
    AI Customize
    Business chart with three line graphs representing data over four years, and yellow, red, and purple captions.
    Add to Wishlist
    Download
    AI Customize
    Horizontal Gantt chart with blue bars representing tasks, timeline from March to April 2020, and gray grid lines.
    Free
    Add to Wishlist
    Download
    AI Customize
    Line chart template with two data series on a dark background, featuring a calculator and pen in the background.
    Add to Wishlist
    Download
    AI Customize
    Project dashboard with colorful bar charts, tables in red and purple, a circular gauge, and four blue phase icons below.
    Free
    Add to Wishlist
    Download
    AI Customize
     Row of colorful tachometers with different needle positions, each paired with a corresponding caption box.
    Add to Wishlist
    Download
    AI Customize
    Creative KPI Dashboard PPT And Google Slides Template
    Add to Wishlist
    Download
    AI Customize
    KPI Dashboard PPT slide displaying project analysis, revenue, profitability, and gap analysis with data visualizations.
    Add to Wishlist
    Download
    AI Customize
    Business KPI dashboard showcasing charts for real estate and page views with pie, bar, and line graph visualizations.
    Add to Wishlist
    Download
    AI Customize
    Executive dashboard slide displaying many charts from new business to operational expenses.
    Add to Wishlist
    Download
    AI Customize
    Colorful infographic with a line graph, pie and bar chart, and numerical data panels in a structured KPI template design.
    Add to Wishlist
    Download
    AI Customize
    Dashboard template showing sales, orders, visitors, and users metrics with visual bar and pie charts for website analysis.
    Add to Wishlist
    Download
    AI Customize
    Professional setting with pie charts showing task distribution in red tones for analysis, collection, and development.
    Add to Wishlist
    Download
    AI Customize
    Dashboard template with a semi-circular gauge indicating performance with a blurred image and caption areas.
    Add to Wishlist
    Download
    AI Customize
    Dashboard slide showing plant growth data with details table and area chart for Zantedeschia, Celosia, and Calendula.
    Add to Wishlist
    Download
    AI Customize
    Gradient peaks showing sales growth percentages in shades of blue and gray, with detailed text on the right dark sidebar.