Creative KPI Dashboard PPT And Google Slides Template

Creative KPI Dashboard PPT And Google Slides Template
P.ID : 1959
    1.4K+ views
    93 Downloads
    Get Custom Slides by Experts
    Instantly Access Templates in PowerPoint

    KPI Dashboard PowerPoint Template


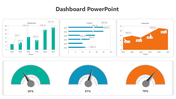
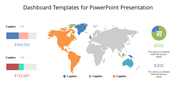
    Unlock the power of informed decision-making with the KPI Dashboard presentation – a comprehensive tool designed to demystify Key Performance Indicators (KPIs). Infused with a vibrant multicolor theme, this slide seamlessly integrates various visualization elements such as line charts, bar charts, tables, and area charts. Tailored for executives, analysts, and decision-makers, KPI presentation serves as a versatile aid for professionals seeking clarity in data-driven insights. The KPI Dashboard empowers users to explore and showcase complex data through an array of visual formats, ensuring a dynamic and engaging experience. From tracking performance trends to facilitating strategic discussions, this presentation is an invaluable asset for those navigating the intricate landscape of data analysis and strategic decision-making.


    Features of this template


    • 100% customizable slides and easy to download.
    • The slide contains 16:9 and 4:3 formats.
    • Easy to change the colors of the slide quickly.
    • Highly compatible with PowerPoint and Google Slides.
    • Well-crafted template with an instant download facility.
    Advertisement

    You May Also Like These PowerPoint Templates

    Add to Wishlist
    Download
    AI Customize
    Green themed dashboard template with three plant growth in line, bar and area chart for different years and species.
    Add to Wishlist
    Download
    AI Customize
    Tachometer PowerPoint template with four stages featuring colorful gauges and caption areas on a white backdrop.
    Add to Wishlist
    Download
    AI Customize
    Dashboard template with two horizontal bar charts, a calendar icon, and circular progress indicators in orange and green.
    Add to Wishlist
    Download
    AI Customize
    Dashboard slide showcasing a semi circular layout with five numbered segments in blue, red, and green, each with captions.
    Add to Wishlist
    Download
    AI Customize
    Project dashboard template with four speedometer charts representing different completion levels with placeholder text.
    Add to Wishlist
    Download
    AI Customize
    Laptop screen displaying a blue bar chart, surrounded by business dashboard elements placed in dark background.
    Add to Wishlist
    Download
    AI Customize
    Infographic featuring two red semicircular speedometers with needles, displaying percentages, and captions below.
    Add to Wishlist
    Download
    AI Customize
    Purple themed dashboard slide featuring multiple charts and a text box for descriptive content.
    Add to Wishlist
    Download
    AI Customize
    Dashboard slide with three blue icons and captions paired with a bar chart on a tablet screen, and a desk setup on the right.
    Add to Wishlist
    Download
    AI Customize
    Yellow speedometer graphic indicating 70%, with a gray needle pointing right and a caption area below.
    Add to Wishlist
    Download
    AI Customize
    Black circular speedometer gauge with a green needle, surrounded by six captions on a white background.
    Free
    Add to Wishlist
    Download
    AI Customize
    Circular speedometer infographic with a black needle, yellow progress arc, and distance markers, next to an text box.
    Add to Wishlist
    Download
    AI Customize
    Sales performance dashboard PowerPoint template with a line graph, pie chart, and percentage change analysis.
    Add to Wishlist
    Download
    AI Customize
    Chart design slide tracking article likes, comments, shares, total posts, and new subscriber growth with visual graphs.
    Add to Wishlist
    Download
    AI Customize
    Speedometer PowerPoint template with yellow background showing a 70 percent reading, along with 50 and 60 percent gauges.
    Free
    Add to Wishlist
    Download
    AI Customize
    Speedometer graphic with a blue progress bar, labeled distance values, and a right-side text box explaining its concept.
    Add to Wishlist
    Download
    AI Customize
    Chart PPT template with bar graphs showing clicks and recipients, a pie chart for email categories, and a line graph.