Awesome Dashboard PowerPoint And Google Slides Template

Dashboard template showing main categories, team metrics, and performance details with various visual elements.
P.ID : 52682
    333 views
    53 Downloads
    Get Custom Slides by Experts
    Instantly Access Templates in PowerPoint

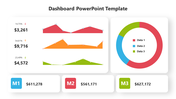
    Creative Dashboard PowerPoint Template 


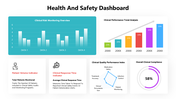
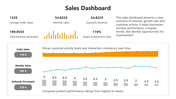
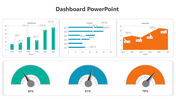
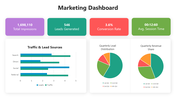
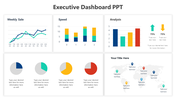
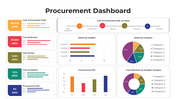
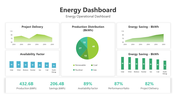
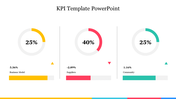
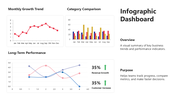
    A dashboard is a vital visual tool utilized across industries to present key performance indicators, metrics, and data in a clear and concise manner, enabling users to swiftly monitor and analyze information. It serves as a centralized hub, amalgamating data from diverse sources like spreadsheets, databases, and software applications, facilitating progress tracking, trend identification, and data-driven decision-making. Dashboards find widespread application in business settings for monitoring performance, tracking project progress, and evaluating marketing campaigns. They boast user-friendly interfaces equipped with interactive features such as filters and drill-down options, empowering users to delve deeper into data and extract valuable insights efficiently. By transforming complex data into comprehensible visualizations, dashboards expedite decision-making, enhance transparency, and bolster overall productivity within organizations. This customizable template caters to professionals in various fields, providing them with the tools to create dynamic and informative dashboards tailored to their specific needs, streamlining reporting processes, tracking KPIs, and effectively communicating insights to stakeholders. With editable slides, presenters can align the template with their branding and data requirements, maximizing impact and engagement while saving time in creating professional-quality dashboards. Users are encouraged to leverage this template to craft compelling dashboards that drive informed decision-making and performance improvements.


    Features of this template


    • 100% customizable slides and easy to download.
    • The slide contains 16:9 and 4:3 formats.
    • Easy to change the colors of the slide quickly.
    • Highly compatible with PowerPoint and Google Slides.
    • Well-crafted template with an instant download facility.
    • Quick and easy edit features. 
    Advertisement

    You May Also Like These PowerPoint Templates

    Add to Wishlist
    Download
    AI Customize
    Dashboard PowerPoint slide featuring three speedometer style gauges displaying percentages with a dartboard graphic.
    Add to Wishlist
    Download
    AI Customize
    Dashboard with charts and metrics, including pie chart for sales, bar and line charts, and visitor statistics.
    Add to Wishlist
    Download
    AI Customize
    Dashboard slide displaying upcoming deposits, transactions, market location, and financial data on a dark backdrop.
    Free
    Add to Wishlist
    Download
    AI Customize
    Dashboard slide with a world map highlighting countries, a bar chart showing statistics, and two percentage indicators.
    Add to Wishlist
    Download
    AI Customize
    Executive dashboard PowerPoint slide featuring line and bar charts, pie charts, and world map markers for data analysis.
    Free
    Add to Wishlist
    Download
    AI Customize
    Five-level bar chart executive dashboard with colored blocks labeled with five levels, showing a gradual progression.
    Add to Wishlist
    Download
    AI Customize
    Dashboard themed PowerPoint slide with six gauges and captions for content.
    Add to Wishlist
    Download
    AI Customize
    Infographic template with bar, pie, and world map charts for PowerPoint presentations in shades of red and orange.
    Add to Wishlist
    Download
    AI Customize
    KPI dashboard with a mix of bar, pie, and line charts highlighting revenue, sales, and customer buying patterns.
    Add to Wishlist
    Download
    AI Customize
    Our Predesigned KPI Presentation Template Slide Design
    Add to Wishlist
    Download
    AI Customize
    Modern dashboard PowerPoint template featuring circular progress charts, bar graphs, and key performance metrics.
    Free
    Add to Wishlist
    Download
    AI Customize
    Bar chart comparing increases and decreases for movies like Avatar and Aquaman, with title logos below.
    Add to Wishlist
    Download
    AI Customize
    Dashboard PPT template with three colored gauges showing 30, 60, and 90 percent completion with captions.
    Add to Wishlist
    Download
    AI Customize
    KPI PowerPoint template with a gauge and table for displaying yearly financial data on a white backdrop.
    Add to Wishlist
    Download
    AI Customize
    KPI slide displaying a financial table for FY 2018, with figures for Net Sales, Income, and Expenses for each quarter.
    Free
    Add to Wishlist
    Download
    AI Customize
    Free KPI PPT Template For Presentation & Google Slides