Free - Essential Dashboard PowerPoint And Google Slides Template

Free
Dashboard with line graphs, a circular chart with three segments, and labeled financial metrics, in red, orange, and green.
P.ID : 2582
    1.3K+ views
    424 Downloads
    Get Custom Slides by Experts
    Instantly Access Templates in PowerPoint

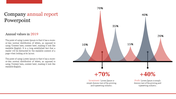
    Creative Dashboard PowerPoint Template


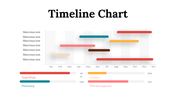
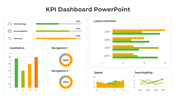
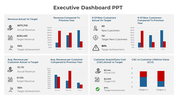
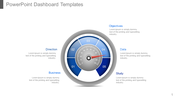
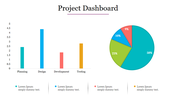
    Enhance your data visualization and decision-making processes with our dynamic Dashboard PowerPoint template. Designed for professionals who need to present complex data in a clear and engaging way, this template offers a comprehensive framework for creating informative and visually appealing dashboards. Perfect for business analysts, managers, and executives, this template features customizable slides for key performance indicators (KPIs), metrics, and data summaries across various business functions like sales, marketing, finance, and operations.


    With its intuitive layout and professional design, you can easily highlight trends, identify insights, and track performance at a glance. Whether you're presenting to stakeholders, conducting a quarterly review, or managing day-to-day operations, this template ensures your data is both accessible and actionable. Elevate your presentations and drive informed decision-making with our versatile Dashboard PowerPoint template. Download today and revolutionize your data reporting!


    Features of this template


    • 100% customizable slides and easy to download.
    • The slide contains 16:9 and 4:3 formats.
    • Easy to change the colors of the slide quickly.
    • Highly compatible with PowerPoint and Google Slides.
    Advertisement

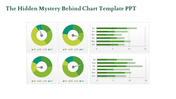
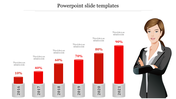
    You May Also Like These PowerPoint Templates

    Free
    Add to Wishlist
    Download
    AI Customize
    Dashboard infographic with three gauge meters in blue, green, and yellow, each labeled with a number and caption.
    Add to Wishlist
    Download
    AI Customize
    KPI dashboard slide with line chart, showing performance for four categories, along with circular percentage indicators.
    Add to Wishlist
    Download
    AI Customize
    Speedometer KPI dashboard showing speed readings for three vehicles a truck, a van, and a car.
    Add to Wishlist
    Download
    AI Customize
    Template showcasing various chart designs, including line, bar, pie, and comparison charts across multiple slides.
    Add to Wishlist
    Download
    AI Customize
    Creative charts showing a circular 60% approval metric, bar graphs, and a 55% Twitter engagement donut chart.
    Free
    Add to Wishlist
    Download
    AI Customize
    PPT slide with a yellow bar chart showing percentages for the years 2016 to 2021 with a woman standing next to the chart.
    Free
    Add to Wishlist
    Download
    AI Customize
    Bar chart comparing metrics over years alongside a diagram linking manager, idea, and management to business growth.
    Add to Wishlist
    Download
    AI Customize
    Funnel infographic with blue, red, yellow, and green sections, each with icons, connected to text descriptions.
    Free
    Add to Wishlist
    Download
    AI Customize
    Four vertical orange columns and percentages, labeled by year, along with a businesswoman illustration on the right.
    Free
    Add to Wishlist
    Download
    AI Customize
    3D green pie chart infographic divided into four steps of varying heights, with numbered labels and descriptions around it.
    Free
    Add to Wishlist
    Download
    AI Customize
    Annual report slide with orange bar graphs showing percentage growth from 2014 to 2021, paired with captions on the left.
    Free
    Add to Wishlist
    Download
    AI Customize
    Chart with colorful bars representing yearly data from 2013 to 2020, paired with eight colorful cube icons on the sides.
    Add to Wishlist
    Download
    AI Customize
    Infographic chart with a truck carrying five colorful blocks and percentage bars, using green, orange, and brown tones.
    Free
    Add to Wishlist
    Download
    AI Customize
    A circular 3D chart in blue, green, purple, and orange representing yearly expansion categories and values.
    Free
    Add to Wishlist
    Download
    AI Customize
    Bar chart PowerPoint slides showcasing different business categories with colorful bars in different layout designs.
    Free
    Add to Wishlist
    Download
    AI Customize
    Vertical bars in purple, blue, green, yellow, orange, and pink showing percentages, next to a businesswoman.
    Add to Wishlist
    Download
    AI Customize
    Dark themed data dashboard with blue line and bar charts, a circular stat gauge, and numerical metrics for analysis.
    Free
    Add to Wishlist
    Download
    AI Customize
    A professional comparison slide featuring horizontal bar graphs displaying various percentages alongside captions with icons.