Attractive Sales Report Dashboard Templates

Slide with a revenue chart and metrics for daily, weekly, and yearly sales, along with three user graphs.
P.ID : 41682
    1.1K+ views
    146 Downloads
    Get Custom Slides by Experts
    Instantly Access Templates in PowerPoint

    Explanatory Sales Dashboard Template

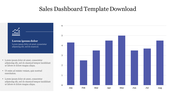
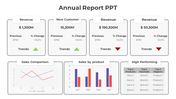
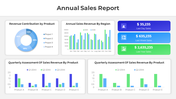
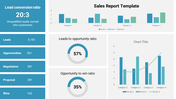
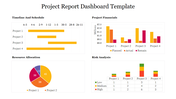
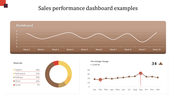
    Give peculiar information about the sales of your business using this enterprising template. A sales dashboard is a BI tool that allows sales teams to track and examine KPIs and share the information across their organization. The analysis is in various graphical representations that share all your information precisely. The numerical specifications impact work, for it, shares assured facts. With this template, you can present the overall sales team's performance during a particular period. So, buy it and make productive use of it.

    Features of this template

    • 100% customizable slides and easy to download
    • Slides are available in different nodes & colors.
    • The slides contained 16:9 and 4:3 formats.
    • Easy to change the slide colors quickly.
    • Well-crafted template with instant download facility.
    • Inventive diagrams are filled.
    • Affable options are filled.
    Advertisement

    You May Also Like These PowerPoint Templates

    Add to Wishlist
    Download
    AI Customize
    Amazing PowerPoint Dashboard Presentation Template
    Add to Wishlist
    Download
    AI Customize
    Circular tachometer gauge with a needle pointing six colored sections, and captions in rounded rectangles connected by lines.
    Free
    Add to Wishlist
    Download
    AI Customize
    Circular gauge style infographic in shades of gray, showing a speedometer with a needle and distance markers.
    Add to Wishlist
    Download
    AI Customize
    A tachometer PowerPoint template with five dials in different colors, each representing a specific section with captions.
    Add to Wishlist
    Download
    AI Customize
    Sales report slide with a world map and a ranking table on the right, listing branches, countries, sales, and managers.
    Add to Wishlist
    Download
    AI Customize
    Cute weekly schedule design featuring colorful sticky notes for Monday to Sunday on a purple backdrop.
    Add to Wishlist
    Download
    AI Customize
    A PPT slide showing survey results with bar graphs and financial data on a laptop screen with placeholder text.
    Add to Wishlist
    Download
    AI Customize
    Product sales report slide with a gray monitor illustration and six labeled icons for different item categories.
    Free
    Add to Wishlist
    Download
    AI Customize
    Two percentage sections with construction site images with workers, and a text with title on the right.
    Add to Wishlist
    Download
    AI Customize
    A 3D pie chart with purple, blue, green, teal, and orange segments showing company annual expenses in various categories.
    Add to Wishlist
    Download
    AI Customize
    Illustration of a business team discussing annual report strategies with data icons in the green background.
    Add to Wishlist
    Download
    AI Customize
    Annual report chart showing income percentages for four categories, with accompanying text for a quarter expansion.
    Add to Wishlist
    Download
    AI Customize
    3D bar chart company report featuring cone-shaped data points for January, February, and March under four categories.
    Add to Wishlist
    Download
    AI Customize
    Infographic with bar graphs in red, purple, yellow, and orange emerging from a smartphone, representing monetary values.
    Add to Wishlist
    Download
    AI Customize
    A weekly report layout with colored headers for each day of the week and space for tasks.
    Free
    Add to Wishlist
    Download
    AI Customize
    Flat style product sales template with a purple monitor displaying analytics, with six fashion item icons arranged around it.
    Free
    Add to Wishlist
    Download
    AI Customize
    Sales strategy slide with a donut chart divided into six colorful segments for acquisition sources and labeled percentages.