Creative Annual Report PPT And Google Slides Template

Annual report template featuring financial metrics, performance comparisons, and graphical data visualizations.
P.ID : 1655
    21 slides
    Infographic slide pack with charts, graphs, and visual elements showing a year in review, featuring colorful designs.
    36 slides
    Slide deck on monthly report designs displayed in a grid layout, featuring charts, graphs, and diagrams in various colors.
    13 slides
    Collection of slides with four blocker report templates, using colorful hexagons, stacked blocks, and circular layouts.
    36 slides
    Business annual report infographic with various data visualization slides for financial and performance analysis.
    1.7K+ views
    487 Downloads
    Get Custom Slides by Experts
    Instantly Access Templates in PowerPoint

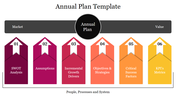
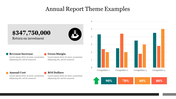
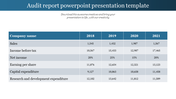
    Annual Report PowerPoint Template


    The Annual Report serves as a vital document issued by organizations to provide stakeholders with a detailed overview of their financial performance, strategic initiatives, and governance practices. Shareholders, investors, analysts, regulators, and employees rely on annual reports to evaluate a company's financial health, growth prospects, and adherence to regulatory standards. Executives and management teams utilize these reports to communicate corporate achievements and future plans transparently. Annual Report template offer a structured format for organizing financial statements, management discussions, and analysis, allowing organizations to create professional and visually appealing reports that effectively convey their performance and strategic direction to stakeholders.


    Features of this template


    • 100% customizable slides and easy to download.
    • Slides are available in different nodes & colors.
    • The slide contained 16:9 and 4:3 formats.
    • Easy to change the slide colors quickly.
    • It is a well-crafted template with an instant download facility.
    Advertisement

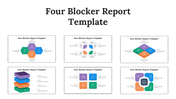
    You May Also Like These PowerPoint Templates

    Add to Wishlist
    Download
    AI Customize
    Bar chart in four pastel colors representing months on the left, and color coded text area with icons on a green background.
    Add to Wishlist
    Download
    AI Customize
    Business report layout with hands typing, line graph on screen, statistics, highlighted title text and colorful elements.
    Free
    Add to Wishlist
    Download
    AI Customize
    Three colored boxes in red, blue, and green, arranged in a row, each representing a different project with text inside.
    Add to Wishlist
    Download
    AI Customize
    Annual report slide with product usage chart and table, detailing sales data, revenue, and profit margins.
    Add to Wishlist
    Download
    AI Customize
    Annual chart with gradient orange bars on the right and a purple section on the left featuring descriptive text.
    Add to Wishlist
    Download
    AI Customize
    Annual report slide deck with black and yellow theme, showing company information, financial data, and strategy charts.
    Add to Wishlist
    Download
    AI Customize
    Detailed project report slide showing a timeline for development phases, budget, schedule, benefits, and a risk issue table.
    Add to Wishlist
    Download
    AI Customize
    Annual report PowerPoint slide with a graph displaying data and the year 2020 in yellow.
    Add to Wishlist
    Download
    AI Customize
    Sales report slide featuring bar charts and data on leads, web users, and program performance for the current month and day.
    Add to Wishlist
    Download
    AI Customize
    Marketing Report PowerPoint And Google Slides Template
    Add to Wishlist
    Download
    AI Customize
    Woman pointing a table with eight colored boxes representing performance management, with pink bordered layout.
    Add to Wishlist
    Download
    AI Customize
    Progress report table displaying different categories with green checks for in progress and red crosses with caption areas.
    Add to Wishlist
    Download
    AI Customize
    Effective Business Progress Report Presentation Template
    Add to Wishlist
    Download
    AI Customize
    Survey results with five percentage figures from 30% to 80% above semi-circles and user icons for presentation download.
    Add to Wishlist
    Download
    AI Customize
    Annual report slide with a colorful chart representing yearly industry expenses, totaling 300K across various categories.