Marketing Report PowerPoint Template and Google Slides

Bar chart in four pastel colors representing months on the left, and color coded text area with icons on a green background.
P.ID : 41638
    1.4K+ views
    190 Downloads
    Get Custom Slides by Experts
    Instantly Access Templates in PowerPoint

    Marketing Report Presentation Slide

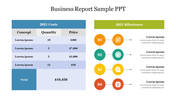
    "What gets measured gets improved." This quote by Peter Drucker Deming highlights the importance of data-driven decision-making in marketing. A practical marketing report provides insights into the performance of marketing campaigns, helping businesses make informed decisions. Using a professionally designed template for a practical marketing report can help you create a clear and visually engaging presentation that highlights key metrics and insights. This template is making it a versatile and practical tool for anyone looking to present marketing-related information effectively.

    Features of the template:

    • 100% customizable slide and easy to download.
    • The slide contained 16:9 and 4:3 formats.
    • Well-crafted template with an instant download facility.
    • Highly Compatible with PowerPoint and Google Slide.
    • This slide has a colorful design pattern.
    • Easy to change the slide's colors.
    Advertisement

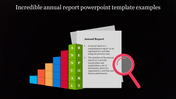
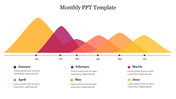
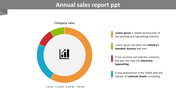
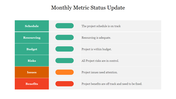
    You May Also Like These PowerPoint Templates

    Add to Wishlist
    Download
    AI Customize
    Six-step supply chain process with hexagonal segments connected by a timeline, from raw materials to purchase.
    Add to Wishlist
    Download
    AI Customize
    Project status report template with a timeline graph from 2016 to 2025 and colored bars indicating monthly progress.
    Add to Wishlist
    Download
    AI Customize
    Medical icons arranged in square buttons on the left, with case report bullet points on the right in a green background.
    Add to Wishlist
    Download
    AI Customize
    Organized weekly planner with days listed in blue tabs and an illustration of two people planning.
    Add to Wishlist
    Download
    AI Customize
    Survey results show percentage breakdowns for categories with corresponding figures and brief descriptions.
    Add to Wishlist
    Download
    AI Customize
    Financial report slide with key performance indicators along with additional metrics showing divident and ratio.
    Add to Wishlist
    Download
    AI Customize
    Best Infographic Survey PowerPoint Template
    Add to Wishlist
    Download
    AI Customize
    Business report template with a monthly timeline chart and three pie charts below with percentages segments.
    Add to Wishlist
    Download
    AI Customize
    Progress report slide with a circular profile image and a four row, three column table with colored bars on the right.
    Add to Wishlist
    Download
    AI Customize
    Slide featuring financial and project overviews with blue circular progress charts, and image of various graphs on the side.
    Add to Wishlist
    Download
    AI Customize
    Split layout with a multicolored pie chart showing five data percentages and a textual checklist in a blue section.
    Free
    Add to Wishlist
    Download
    AI Customize
    Weekly report layout with a goals checklist on the left and a yellow bordered table for days and columns on the right.
    Add to Wishlist
    Download
    AI Customize
    Colorful pyramid chart with five levels, each topped with a percentage and connected to icons on the right.
    Add to Wishlist
    Download
    AI Customize
    Yearly financial report slide with key figures and graphical data on shareholder returns and business line earnings.
    Add to Wishlist
    Download
    AI Customize
    A teal status report slide with a donut chart showing percentages and a table on the right detailing project phases.