Best Business Report Infographics PowerPoint Presentation

Pack of 36 slides
P.ID : 69047
Advertisement
916 views
180 Downloads
Get Custom Slides by Experts
Instantly Access Templates in PowerPoint

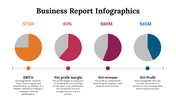
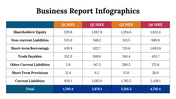
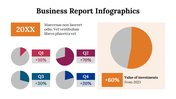
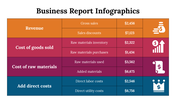
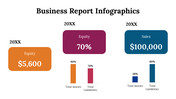
Innovative Pack of Business Report Templates

How often do you find yourself putting off the due date to the next day? Despite how convenient it is to put off duties until later, why not finish them right away? Today will never come around again, but tomorrow will always come around. Therefore, ensure that your presentation runs well and on schedule. Use this creative collection of business report templates to detail every aspect of your operations. There are 36 great slides in the pack. Get a bird's eye perspective of your business at all times! Keep it simple. Give your audience a decent amount of information. Keep things clear and focus on your core message.

Features of the template

  • 100 % customizable slides and easy to download.
  • Slides are available in different colors
  • The slide has 4:3 and 16:9 formats.
  • Easy to change the slide colors quickly.
  • Appealing presentation to impress an audience.
  • Create feature-rich slide presentations. 
  • An eye-pleasing color slide helps to give a catchy presentation.
  • The slide is compatible with Google slides.
  • Colorful pack of 36 slides.

You May Also Like These PowerPoint Templates

Add to Wishlist
Download
AI Customize
Digital planner showcasing two months with highlighted days in blue, red, and green placed in white background.
Add to Wishlist
Download
AI Customize
Marketing Report PowerPoint And Google Slides Template
Add to Wishlist
Download
AI Customize
Woman pointing a table with eight colored boxes representing performance management, with pink bordered layout.
Add to Wishlist
Download
AI Customize
Progress report table displaying different categories with green checks for in progress and red crosses with caption areas.
Add to Wishlist
Download
AI Customize
Effective Business Progress Report Presentation Template
Add to Wishlist
Download
AI Customize
Survey results with five percentage figures from 30% to 80% above semi-circles and user icons for presentation download.
Add to Wishlist
Download
AI Customize
Weekly planner slide with five vertical columns, in green, orange, pink, purple, and blue, labeled Monday to Friday.
Add to Wishlist
Download
AI Customize
Timing PowerPoint slide with a daily schedule table and an illustration of a person sitting next to an hourglass.
Add to Wishlist
Download
AI Customize
Finance report slide displaying a table of expenses, net income, and profit from 2013 to 2019, with a bar chart below.
Free
Add to Wishlist
Download
AI Customize
Slide with a colorful circular chart divided into orange, green, red, and blue segments, centered with a black bar chart.
Add to Wishlist
Download
AI Customize
Horizontal table with metric labels in colorful blocks on the left and status bars with descriptions on the right.
Add to Wishlist
Download
AI Customize
Effective Business Report Sample PPT Presentation Slide
Add to Wishlist
Download
AI Customize
Quarterly report slide with a vertical red arrow marking Q1 to Q4 in colorful circles and text rows on a teal background.
Add to Wishlist
Download
AI Customize
Six-step supply chain process with hexagonal segments connected by a timeline, from raw materials to purchase.
Add to Wishlist
Download
AI Customize
Project status report template with a timeline graph from 2016 to 2025 and colored bars indicating monthly progress.
Add to Wishlist
Download
AI Customize
Medical icons arranged in square buttons on the left, with case report bullet points on the right in a green background.
Add to Wishlist
Download
AI Customize
Organized weekly planner with days listed in blue tabs and an illustration of two people planning.
Add to Wishlist
Download
AI Customize
Survey results show percentage breakdowns for categories with corresponding figures and brief descriptions.
Add to Wishlist
Download
AI Customize
Financial report slide with key performance indicators along with additional metrics showing divident and ratio.
Add to Wishlist
Download
AI Customize
Best Infographic Survey PowerPoint Template
Add to Wishlist
Download
AI Customize
Business report template with a monthly timeline chart and three pie charts below with percentages segments.
Add to Wishlist
Download
AI Customize
Progress report slide with a circular profile image and a four row, three column table with colored bars on the right.
Add to Wishlist
Download
AI Customize
Slide featuring financial and project overviews with blue circular progress charts, and image of various graphs on the side.
Add to Wishlist
Download
AI Customize
Split layout with a multicolored pie chart showing five data percentages and a textual checklist in a blue section.
Free
Add to Wishlist
Download
AI Customize
Weekly report layout with a goals checklist on the left and a yellow bordered table for days and columns on the right.
Add to Wishlist
Download
AI Customize
Colorful pyramid chart with five levels, each topped with a percentage and connected to icons on the right.
Add to Wishlist
Download
AI Customize
Yearly financial report slide with key figures and graphical data on shareholder returns and business line earnings.
Add to Wishlist
Download
AI Customize
A teal status report slide with a donut chart showing percentages and a table on the right detailing project phases.
Add to Wishlist
Download
AI Customize
Infographic displaying social media engagement metrics alongside a business-themed illustration.