Annual Report PowerPoint Presentation And Google Slides


 Canva
Canva
Annual Report PowerPoint, Google Slides, and Canva Template
Presenting yearly performance becomes more effective when information is structured clearly, and this annual report presentation helps you communicate your business results in a professional and organized way. It is designed for business leaders, finance teams, corporate professionals, and students who want to present annual insights with clarity and confidence.
This presentation includes 10 well-designed slides with a modern blue and green color theme that reflects growth, stability, and trust. The clean layout keeps your data visually organized, making it suitable for board meetings, investor presentations, and corporate reviews.
The slides cover key sections such as company overview, vision and mission, and year highlights, helping you set a strong foundation for your report. Each section is designed to present important business information in a simple and structured format.
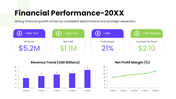
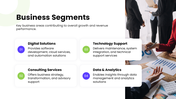
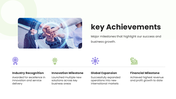
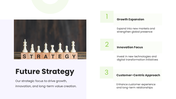
It also includes slides for financial performance, business segments, key achievements, and future strategy. These sections help you explain performance metrics, growth areas, and long-term plans clearly and engagingly.
Use this annual report presentation to present your company’s performance with clarity and professionalism. Download now and confidently showcase your annual results with a strong and impactful presentation.
Features of this template
- 100% customizable slides and easy to download.
- The slides contain 16:9 and 4:3 formats.
- Easy to change the colors quickly.
- Highly compatible with PowerPoint, Google Slides, and Canva templates.


You May Also Like These PowerPoint Templates


