Free - Company Annual Report PowerPoint Presentation & Google Slide

Free
Annual report slide displaying a bar chart with color-coded percentages from 30% to 80% and caption areas.
P.ID : 291
    5.5K+ views
    1.3K+ Downloads
    Get Custom Slides by Experts
    Instantly Access Templates in PowerPoint

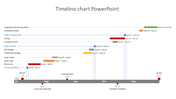
    Creative annual report ppt template

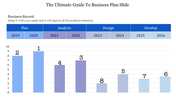
    Company annual report PowerPoint presentation template that can win the heart of your clients and customers. Making the Templates, the understanding process for the client is made easier for the clients. 

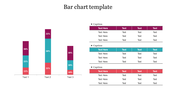
    The template will undoubtedly be neat and straightforward to represent the data in a bar graph. The template is multi nodes with different colors for each node. You can show the sales rate using this template. The left side is given with a number line, and the center portion is given with bar graphs to show the sales report in the annual business meetings. You can also find more sales report templates at Slide Egg!

    This template is fully customized, and so the information can be easily understood by the audience. The template has user-friendly features to modify and create a template to explain the report with much effort. So make sure to download this company annual report PowerPoint presentation template and get appreciation from the audience. 

    Features of this template:

    • It is 100% customizable and straightforward to download.
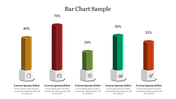
    • The Slides are available in different nodes & colors.
    • The slide contained 16:9 and 4:3 format.
    • It is easy to change the slide colors quickly.
    • It is a well-crafted template with an instant download facility.
    • Bar graph design and multiple colors to attract the audience. 
    Advertisement

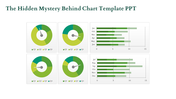
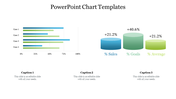
    You May Also Like These PowerPoint Templates

    Add to Wishlist
    Download
    AI Customize
    KPI dashboard with bar graphs showing data trends over time and two green summary boxes.
    Add to Wishlist
    Download
    AI Customize
    Vehicle dashboard slide featuring a speedometer on the left and a detailed table on the right with its brands.
    Free
    Add to Wishlist
    Download
    AI Customize
    A PPT chart template featuring a table layout with rows labeled Text and columns with bar charts in different shades of blue.
    Add to Wishlist
    Download
    AI Customize
    Slide with multiple charts including bar, line, and pie charts illustrating data for hires, turnover, and training.
    Free
    Add to Wishlist
    Download
    AI Customize
    Visual of project phases and value generation over time, with milestones labeled as planning, detailing, and implementation.
    Add to Wishlist
    Download
    AI Customize
    Business column chart template showing four bar sections, each representing industries with icons and data percentages.
    Add to Wishlist
    Download
    AI Customize
    Business slide with four sections representing different concepts Equality, Human Rights, Independent, and Multi Party.
    Add to Wishlist
    Download
    AI Customize
    Executive dashboard with a pie chart, vertical and horizontal bar graph, and a waterfall chart, displaying various data.
    Add to Wishlist
    Download
    AI Customize
    Business dashboard featuring a profile card, three financial metrics, a 67% circular chart, and a dual-colored area graph.
    Add to Wishlist
    Download
    AI Customize
    A colorful dashboard PowerPoint slide featuring graphs, stats, and a pie chart for a data driven presentation with captions.
    Free
    Add to Wishlist
    Download
    AI Customize
    Five-step timeline with icons for connectivity, achievement, computers, pie chart, and security, paired with text.
    Add to Wishlist
    Download
    AI Customize
    Dashboard PowerPoint slide featuring three speedometer style gauges displaying percentages with a dartboard graphic.
    Add to Wishlist
    Download
    AI Customize
    Dashboard with charts and metrics, including pie chart for sales, bar and line charts, and visitor statistics.
    Free
    Add to Wishlist
    Download
    AI Customize
    Line chart with data points marked by blue squares and black dots, displaying values from 2006 to 2014.
    Add to Wishlist
    Download
    AI Customize
    Dashboard slide displaying upcoming deposits, transactions, market location, and financial data on a dark backdrop.
    Add to Wishlist
    Download
    AI Customize
    Executive dashboard PowerPoint slide featuring line and bar charts, pie charts, and world map markers for data analysis.
    Add to Wishlist
    Download
    AI Customize
    Bar chart with colorful columns of varying heights representing percentages, with social media icons below.
    Add to Wishlist
    Download
    AI Customize
    Dashboard themed PowerPoint slide with six gauges and captions for content.
    Add to Wishlist
    Download
    AI Customize
    Infographic template with bar, pie, and world map charts for PowerPoint presentations in shades of red and orange.
    Add to Wishlist
    Download
    AI Customize
    KPI dashboard with a mix of bar, pie, and line charts highlighting revenue, sales, and customer buying patterns.