Creative Line Chart PPT Presentation Template Slide

A line chart  slide showing data trends across seven items with two percentage indicators with icons and caption areas.
P.ID : 60253
    350 views
    51 Downloads
    Get Custom Slides by Experts
    Instantly Access Templates in PowerPoint

    Two Noded Line Chart PowerPoint Slide

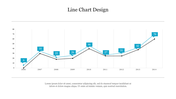
    Highlight important corporate statistics in a line chart format using this well-designed Line Chart PPT Presentation Template. It helps to make a very attractive and informative presentation. It also helps you in making good visual presentations and managing data properly. This chart PPT template is very useful for various business audiences and a must for any type of professional.

    The Line Chart PPT Presentation Template has a multi-color line chart. Using this slide, you can analyze the values very easily and quickly. This slide helps to compare two sets of data, such as target and growth. It is very easy for your audience to understand and analyze the data presented. You can edit the graph, colors, values, background, text format, etc.

    Features of this template:

    1. 100% customizable slides and easy to download.
    2. Slides available in different nodes & colors.
    3. The slide contained 16:9 and 4:3 format.
    4. Easy to change the slide colors quickly.
    5. Well-crafted template with instant download facility.
    6. It has a clean and well-designed line chart.
    Advertisement

    You May Also Like These PowerPoint Templates

    Free
    Add to Wishlist
    Download
    AI Customize
    Four vertical orange columns and percentages, labeled by year, along with a businesswoman illustration on the right.
    Add to Wishlist
    Download
    AI Customize
    Botanical data dashboard template  showing performance metrics for flower species, featuring line and bar charts.
    Add to Wishlist
    Download
    AI Customize
    PowerPoint slide with multiple chart types, including bar, line, and pie charts with different styles.
    Free
    Add to Wishlist
    Download
    AI Customize
    3D green pie chart infographic divided into four steps of varying heights, with numbered labels and descriptions around it.
    Free
    Add to Wishlist
    Download
    AI Customize
    Annual report slide with orange bar graphs showing percentage growth from 2014 to 2021, paired with captions on the left.
    Add to Wishlist
    Download
    AI Customize
    Gantt chart PPT slide displaying tasks with start and end dates, milestones, and progress tracking for each month.
    Add to Wishlist
    Download
    AI Customize
    KPI dashboard featuring a funnel chart, audience metrics, bar graph, and a circular chart with 2021 data.
    Add to Wishlist
    Download
    AI Customize
    Infographic chart with a truck carrying five colorful blocks and percentage bars, using green, orange, and brown tones.
    Add to Wishlist
    Download
    AI Customize
    KPI dashboard template with four gauges in blue, green, orange, and red, alongside a flowchart with colored boxes.
    Free
    Add to Wishlist
    Download
    AI Customize
    Slide featuring a bar graph and line chart showing monthly money transactions, alongside silhouettes of people shaking hands.
    Add to Wishlist
    Download
    AI Customize
    Gantt chart slide with monthly columns showing project tasks and subtasks progress using blue shades to indicate status.
    Free
    Add to Wishlist
    Download
    AI Customize
    Gantt chart slide with monthly timeline across three teams, using blue, orange, and green bars to indicate priority items.
    Add to Wishlist
    Download
    AI Customize
    Dashboard showing expense meters, global percentages on a map, and a bar chart visualizing data distribution.
    Add to Wishlist
    Download
    AI Customize
    Slide deck with KPI charts and graphs for business analysis, including financials, HR performance, and customer service.
    Add to Wishlist
    Download
    AI Customize
    KPI dashboard template with a line chart, progress indicators, and bar graphs showing different performance metrics.
    Free
    Add to Wishlist
    Download
    AI Customize
    Vertical bars in purple, blue, green, yellow, orange, and pink showing percentages, next to a businesswoman.
    Free
    Add to Wishlist
    Download
    AI Customize
    Project dashboard slide for electricity data with bar graphs showing units and amounts for different categories and months.