Customized PowerPoint Charts Template Presentation

Customized PowerPoint Charts Template Presentation
P.ID : 46219
    361 views
    56 Downloads
    Get Custom Slides by Experts
    Instantly Access Templates in PowerPoint

    Charts PPT Templates and Google Slides 


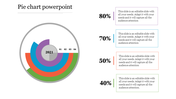
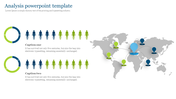
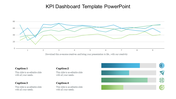
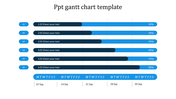
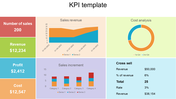
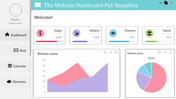
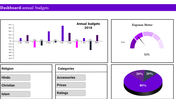
    Transform Data into Impactful Stories with Our Charts PowerPoint Template! Numbers and statistics can be dry, but they don't have to be. Dive into the world of data visualization mastery with our PowerPoint Charts Template, and watch your presentations come to life. Imagine effortlessly turning raw data into compelling narratives that resonate with your audience. Our templates do just that. They're not just charts; they're your key to creating dynamic, insightful presentations. From bar graphs that show trends to pie charts that highlight proportions, our PowerPoint Charts Template offers a diverse array of chart types. Whatever your data needs, we've got the perfect chart to convey your message effectively. Crafting professional, engaging charts doesn't have to be complex. Our templates are user-friendly, allowing you to customize and create stunning visuals with ease. Leave a lasting impression with visuals that tell a story. Our PowerPoint Charts Template empowers you to captivate your audience, making your data-driven presentations unforgettable.

    Features of the template:

    • 100% customizable slides and easy to download.
    • This slide contains 16:9 and 4:3 formats.
    • Highly compatible with Google Slides and PowerPoint.
    • It is easy to change the slide colors quickly.
    • It is a well-crafted template with an instant download facility 
    Advertisement

    You May Also Like These PowerPoint Templates

    Add to Wishlist
    Download
    AI Customize
    Professional setting with pie charts showing task distribution in red tones for analysis, collection, and development.
    Add to Wishlist
    Download
    AI Customize
    Project overview dashboard template with area chart, line charts for time intervals, and percentage indicators.
    Add to Wishlist
    Download
    AI Customize
    Gradient peaks showing sales growth percentages in shades of blue and gray, with detailed text on the right dark sidebar.
    Add to Wishlist
    Download
    AI Customize
    Slide featuring a blue-toned pie chart representing sales revenue percentages, with captions areas for each segment.
    Add to Wishlist
    Download
    AI Customize
    Row of pie charts with varying color schemes for data visualization each place diwth caption areas.
    Add to Wishlist
    Download
    AI Customize
    Dashboard chart displaying social media subscribers by gender, age, most read articles, and categories in 2019.
    Add to Wishlist
    Download
    AI Customize
    Three pie charts in red, yellow, and blue with percentage values, arranged horizontally with text below.
    Add to Wishlist
    Download
    AI Customize
    Six-month Gantt chart template spanning July to December 2020 with weekly divisions and task rows.
    Add to Wishlist
    Download
    AI Customize
    Five segment pie chart in orange, blue, red, green, and pink, each with number and connected with text areas.
    Free
    Add to Wishlist
    Download
    AI Customize
    Line chart in teal showing data points from 2013 to 2020 on a white background, with five icons listed on the right.
    Free
    Add to Wishlist
    Download
    AI Customize
    Histogram on the left and Pareto chart in pink and orange with cumulative line on the right.
    Free
    Add to Wishlist
    Download
    AI Customize
    Four blue pyramid shapes in ascending size, labeled with percentages, aligned over a horizontal gray bar.
    Add to Wishlist
    Download
    AI Customize
    A pie chart featuring five segments, each labeled with percentages, surrounded by text on a blue background.
    Add to Wishlist
    Download
    AI Customize
    Horizontal bar graph slide with four colored steps and corresponding descriptions on the right.
    Add to Wishlist
    Download
    AI Customize
    Slide with two donut charts displaying values and a text section on the right with a blurred background image.
    Add to Wishlist
    Download
    AI Customize
    Stacked column chart template displaying proportional data distribution across four categories using three series.
    Add to Wishlist
    Download
    AI Customize
    Colorful circular diagram slide illustrating four corporate strategy methods with labels and percentages.