Free - We have the Best Collection of Chart Presentation Slides

Free
Comparison of revenue and cost distributions with pie charts displaying CAPEX and OPEX percentages.
P.ID : 17842
    1.3K+ views
    339 Downloads
    Get Custom Slides by Experts
    Instantly Access Templates in PowerPoint

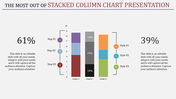
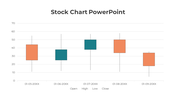
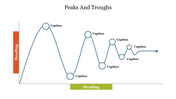
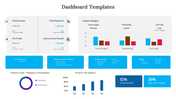
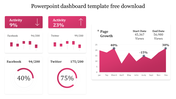
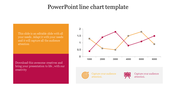
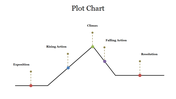
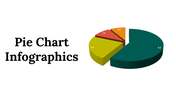
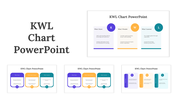
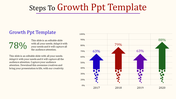
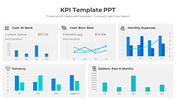
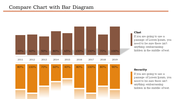
    Capturing Chart Presentation Templates

    Unleash the power of chart presentation templates to breathe life into your data! Witness the magic as mundane numbers and information evolve into captivating and informative charts. No matter if you're sharing survey results, dissecting trends, or displaying statistics, these templates are your ultimate solution. With their intuitive designs, customizable features, and a plethora of chart options, you'll effortlessly create impactful presentations that mesmerize your audience. From dynamic pie charts to insightful bar graphs and beyond, these templates revolutionize data presentation. Get set to awe your teachers and classmates with the captivating charm of chart presentation templates!

    Features of this template

    • 100% customizable slides and easy to download
    • Slides are available in different nodes & colors.
    • The slides contain 16:9 and 4:3 formats.
    • Easy to change the slide colors quickly.
    • Present sound slides.
    • All your money is saved.
    • Compatible with google slides and MS Word.
    Advertisement

    You May Also Like These PowerPoint Templates

    Add to Wishlist
    Download
    AI Customize
    A treasurer’s annual report slide featuring a bar chart and line graph in purple and blue with the title.
    Add to Wishlist
    Download
    AI Customize
    Infographic bar chart slide displaying daily comparisons for Business System and Supplier metrics.
    Add to Wishlist
    Download
    AI Customize
    Amazing Dashboard PowerPoint Template And Google Slides
    Add to Wishlist
    Download
    AI Customize
    Slide showcasing four circular progress charts with percentages in alternating teal and black accents.
    Add to Wishlist
    Download
    AI Customize
    Comparison chart with horizontal green bars displaying data for four examples across three series.
    Add to Wishlist
    Download
    AI Customize
    Pie chart highlighting percentages for four steps with a caption areas in a circular layout placed in a grey backdrop.
    Free
    Add to Wishlist
    Download
    AI Customize
    A slide showing a colorful KWL chart with sections for knowledge, inquiry, and learning outcomes with placeholder text.
    Free
    Add to Wishlist
    Download
    AI Customize
    Pie chart presentation slide showing three charts with percentages with text placeholders.
    Add to Wishlist
    Download
    AI Customize
    A bar chart with four categories displaying stacked colored bars, representing three series in orange, blue, and red.
    Add to Wishlist
    Download
    AI Customize
    Circular chart with seven pastel colored segments, each with  icons and captions around it.
    Add to Wishlist
    Download
    AI Customize
    3D bar chart with green, red, yellow, and blue bars for business metrics, with a percentage indicator on the right.
    Add to Wishlist
    Download
    AI Customize
    Circular progress indicators in purple, red, blue, and teal, each paired with a percentage and a relevant icon.
    Add to Wishlist
    Download
    AI Customize
    Pie chart slide showing budget distribution for facebook, google, and linkedIn ads with respective percentages.
    Add to Wishlist
    Download
    AI Customize
    Stacked bar chart template with green gradients, showing data from 2017 to 2020, with labeled sections.
    Add to Wishlist
    Download
    AI Customize
    Three pie charts in brown, blue, and green sections, each with labeled percentages and caption lines.
    Free
    Add to Wishlist
    Download
    AI Customize
    Multicolored circular pie chart in yellow, red, and green, with labeled categories listed on the right.
    Free
    Add to Wishlist
    Download
    AI Customize
    Bar chart with five vertical bars representing data analysis with various high, low, and volume indicators displayed.
    Add to Wishlist
    Download
    AI Customize
    A monthly PowerPoint template displaying colorful wave like graphs for each month from January to June with placeholder text.