MILESTONE 🌟 5 Million+ creative minds trust SlideEgg! Grab 80% OFF

Innovative KWL Chart PowerPoint Slide For Presentation

KWL chart with sections  in blue, green, and red, each column containing placeholder text.
P.ID : 65549
    137 views
    18 Downloads
    Get Custom Slides by Experts
    Instantly Access Templates in PowerPoint

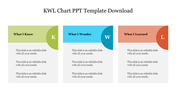
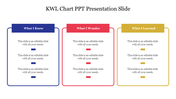
    Three Noded KWL Chart PPT Slide


    Get this innovative KWL Chart PowerPoint Slide and make a fantastic presentation at ease. This theme is very versatile, and you can easily customize it to suit your needs. It allows you to edit the background, colors, nodes, and font. You can use this text box info graphic slide in your education presentations. Hurry to grab!

    About the template:

    The KWL Chart PowerPoint Slide includes three colorful text holders with creative and attractive headers. The titles are labeled with the letters K, W, and L. The white background nicely enhances the creative info graphics. It allows you to present your findings inside the graphics. We also offer Free KWL Chart PowerPoint Slides. Try today!

    Features of this template:

    1. 100% customizable slides and easy to download.
    2. Slides available in different nodes & colors.
    3. The slide contained 16:9 and 4:3 formats.
    4. Easy to change the slide colors quickly.
    5. Well-crafted template with instant download facility.
    6. It has nice and creative designs.
    Advertisement

    You May Also Like These PowerPoint Templates

    Add to Wishlist
    Download
    AI Customize
    Chart template featuring bar, line, and calendar charts with editable placeholders for Q1, Q2, and monthly data.
    Add to Wishlist
    Download
    AI Customize
    Best Waterfall In PowerPoint Presentation Slide Designs
    Free
    Add to Wishlist
    Download
    AI Customize
    Layered area chart with Series 1 in yellow, Series 2 in orange, and Series 3 in black, showing data trends over time.
    Add to Wishlist
    Download
    AI Customize
    Clustered bar chart comparing data across quarters with horizontal bars in various colors.
    Add to Wishlist
    Download
    AI Customize
    Slide with three vertical boxes in blue, red, and green banners, and rounded icons labeled K, W, and L for learning stages.
    Add to Wishlist
    Download
    AI Customize
    PowerPoint chart template showing stacked bar graphs with different categories and values for each year from 2016 to 2019.
    Add to Wishlist
    Download
    AI Customize
    Line graph infographic showing data from 2015 to 2020, with three colored lines in purple, yellow, and green, and text.
    Add to Wishlist
    Download
    AI Customize
    Donut chart in blue and orange displaying percentage, with matching colored caption boxes on either side.
    Add to Wishlist
    Download
    AI Customize
    Our Predesigned Chart Templates PPT Slides Designs
    Add to Wishlist
    Download
    AI Customize
    KWL chart slide with three columns in blue, red, and gold, representing learning insights.
    Add to Wishlist
    Download
    AI Customize
    Infographic with four bar graphs, each showing data points A to D, and captions areas in green boxes.
    Add to Wishlist
    Download
    AI Customize
    Dashboard with a bar chart and pie chart in purple shades, comparing project status across regional shares.
    Free
    Add to Wishlist
    Download
    AI Customize
    PowerPoint presentation slide featuring a stacked bar chart, aerial landscape photo, and a comparison table of drone data.
    Add to Wishlist
    Download
    AI Customize
    Customized Kubler Ross PowerPoint Presentation Template
    Add to Wishlist
    Download
    AI Customize
    Visual of boost engagement growth with stacked bar categories: newsletter sign-ups, premium customers, and followers.
    Add to Wishlist
    Download
    AI Customize
    Pie charts showing data percentages for growth, with three percentage values with placeholder text.
    Add to Wishlist
    Download
    AI Customize
    A medical themed PowerPoint slide with three colorful circular progress bars showing percentages, each with related icons.
    Free
    Add to Wishlist
    Download
    AI Customize
    Chart infographic with four drop shaped gauge style meters in blue, green, yellow, and red, each with text below.