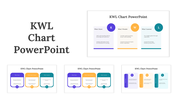
Our Predesigned Presentation PowerPoint Chart PPT Slides

Creative Charts PPT Slide
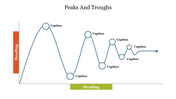
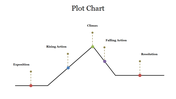
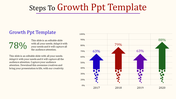
Charting best describes how the economy is progressing. If you are up to date with the latest trends and chart analysis, this chart template will be a perfect guide for you. Here is the spot-on slide to analyze the growth, progress, and more. Coming with real-life examples that can be used for your PPTs, this slide breaks ground with an elegant look for data presentation. With some practice, you can become a pro at creating circular charts with this template! Those five nodes in the circular chart can never be missed out, right? So, Get the benefit of this lucky draw.
Features of the template
- 100% customizable slides and easy to download.
- Slides are available in different nodes & colors.
- The slide contained 16:9 and 4:3 formats.
- Easy to change the slide colors quickly.
- Well-crafted template with an instant download option.
- Five nodes with ample text area.


You May Also Like These PowerPoint Templates
Add to Wishlist
Download
Edit


Add to Wishlist
Download
Edit

Add to Wishlist
Download
Edit

Add to Wishlist
Download
Edit

Add to Wishlist
Download
Edit

Add to Wishlist
Download
Edit

Add to Wishlist
Download
Edit

Add to Wishlist
Download
Edit

Add to Wishlist
Download
Edit

Add to Wishlist
Download
Edit


Add to Wishlist
Download
Edit

Add to Wishlist
Download
Edit

Add to Wishlist
Download
Edit


Add to Wishlist
Download
Edit
