Statistical Infographics Presentation Templates
You can breathe a sigh of relief when it comes to PPT presentations using Slide Egg. Make waves with Creative Free Statistical Infographic PowerPoint Templates and Google Slides Themes to explain and group different components of a report. Put yourself in the heart of your audience!


Make Stats Sparkle with Easy our Free Statistical Infographics PowerPoint Templates and Google Slides Themes!
We're here to help you!
What is Statistical Infographic?
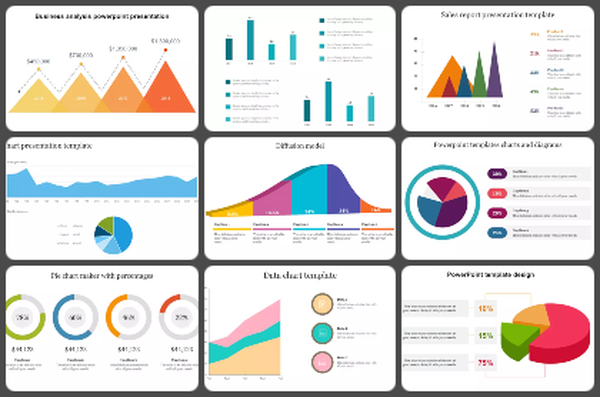
A statistical infographic is a visual representation of data or facts used to quickly and easily communicate complex information.
What are Statistical Infographics PowerPoint Templates?
Statistical infographics PowerPoint templates are pre-made slideshows that help presenters to visualize complex data. They include graphs, charts, tables, and other visuals that make it easier to understand the data.
Where can we use these Statistical Infographics Slides?
You can use these Statistical Infographics Slides in business presentations, classroom lectures, and other educational sessions.
How can I make Statistical Infographics PPT Slides in a presentation?
Start by collecting data and information you want to present in your statistical infographic PPT. Add text to explain the data and provide context. Make sure to keep the text concise and to the point. Suppose you want to learn how to use the PowerPoint tool. Visit Tips and tricks for detailed instructions.
Who can use Statistical Infographics PPT Templates?
Anyone can use Statistical Infographics PPT Templates. They can be used by data analysts, business professionals, students, educators, marketers, and more.
Why do we need Statistical Infographics PowerPoint Slides?
Statistical infographics PowerPoint slides are used to help present data in a visually appealing way that is easy to understand. They are used in presentations to help illustrate complex data sets, trends, and patterns.
Where can I find free Statistical Infographics PPT Templates?
Many websites offer free Statistical Infographics PPT templates. Slide egg is one of the best PowerPoint providers. Our websites' uniquely designed templates help you to illustrate critical insights and conclusions to a target audience.