Best Statistics PowerPoint And Google Slides Template

Statistics slide with bar charts, line graphs, and progress indicators showing mobile users and social media budgets.
P.ID : 8577
    1.7K+ views
    191 Downloads
    Get Custom Slides by Experts
    Instantly Access Templates in PowerPoint

    Statistics PowerPoint Slide


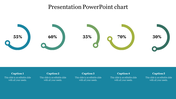
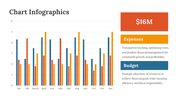
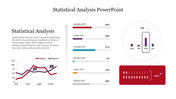
    Transform your data into compelling visual stories with our statistics PPT and Google Slides template. Designed to simplify complex statistical concepts, this template provides a helpful content base for presenting data-driven insights effectively. Whether you're analyzing trends, showcasing survey results, or illustrating numerical findings, our template offers the perfect platform to convey your message with clarity and impact. One of the standout features of this template is its 100% editable and customizable design. Tailor the charts and graphs to suit your specific data and presentation needs effortlessly. With user-friendly functionalities, you can editable color, chart, and layouts to align perfectly with your needs. Don't settle for dull and uninspiring presentations. Elevate your statistics presentations to new heights with our professional and versatile template. Download it today and unleash the power of your data!

    Feature of this template


    • 100% customizable slides and easy to download.
    • The slide contains 16:9 and 4:3 formats.
    • Easy to change the colors of the slide quickly.
    • Highly compatible with PowerPoint and Google Slides.
    Advertisement

    You May Also Like These PowerPoint Templates

    Add to Wishlist
    Download
    AI Customize
    Chart presentation template showing statistics for total clients, projects, and earnings with bar graphs.
    Free
    Add to Wishlist
    Download
    AI Customize
    PPT slide with a line chart showing monthly data and two pie charts for quarterly breakdown.
    Add to Wishlist
    Download
    AI Customize
    Slide with three donut shaped percentage charts showing 70%, 50%, and 90%, with corresponding captions beneath each.
    Add to Wishlist
    Download
    AI Customize
    Horizontal progress bars in red and blue, labeled with percentages, along with four labeled stages below.
    Add to Wishlist
    Download
    AI Customize
    Illustration of people analyzing charts on large screens, with text on the right side.
    Add to Wishlist
    Download
    AI Customize
    A colorful statistics slide featuring various charts including a world map, bar graphs, and a pie chart with text area.
    Add to Wishlist
    Download
    AI Customize
    Statistics slide with bar charts, line graphs, and progress indicators showing mobile users and social media budgets.
    Add to Wishlist
    Download
    AI Customize
    Diffusion model curve divided into five colored sections in yellow, pink, teal, blue, and orange, with percentages.
    Add to Wishlist
    Download
    AI Customize
    Statistics slide showing four bar charts with monthly data for April to July, including numerical values and icons.
    Add to Wishlist
    Download
    AI Customize
    Astounding Inferential Statistics PPT And Google Slides
    Free
    Add to Wishlist
    Download
    AI Customize
    Colorful statistics slide featuring various charts and graphs, including bar graphs, pie charts, and gender icons.
    Add to Wishlist
    Download
    AI Customize
    Statistics template featuring a bar chart and line graph, with placeholder text areas for detailed data descriptions.
    Free
    Add to Wishlist
    Download
    AI Customize
    Data statistics template featuring bar graphs, percentages, and text sections for detailed analysis with caption areas.
    Add to Wishlist
    Download
    AI Customize
    Four interlocked green and black squares with business icons, positioned alongside labeled captions.
    Add to Wishlist
    Download
    AI Customize
    A data statistics PowerPoint template displaying a chart with monthly trends and comparisons between regions.