Creative Statistical Analysis PowerPoint Presentation Slide

Creative Statistical Analysis PowerPoint Presentation Slide
P.ID : 66727
    11 slides
    Organizational assessment slide deck highlighting mission at the center, surrounded by four elements with level indicators.
    11 slides
    Customer analytics slide deck with five diamond icons representing steps from customer experience to data collection.
    14 slides
    Target market analysis slides with blue and yellow designs with text descriptions.
    811 views
    96 Downloads
    Get Custom Slides by Experts
    Instantly Access Templates in PowerPoint

    Unique Statistical Analysis PowerPoint PPT Template

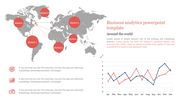
    Grab this statistical analysis PowerPoint slide; it is about collecting, exploring and presenting a large amount of data to discover the patterns underlying. The statistics are applied in everyday life like research, industry and government. Try these statistics slides to share the decisions that need to be made.

    About the template:

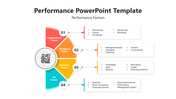
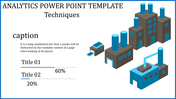
    Get this statistical analysis PowerPoint template that contains a white background that helps to make your slide look brighter with the texts and images. The template contains the graph chart to show the difference, and it also has a horizontal line with percentages and the various animated icons related to statics. You can customize the template with many other features provided by SlideEgg.

    Download this slide to give brief information to the audience to get benefits through this template. And explore our other slide of data analytics presentation PPT from SlideEgg.

    Features of the slide:

    1.100% customizable slides and easy to download.
    2. Slides available in different nodes & colors.
    3. The slides contained 16:9 and 4:3 formats.
    4. Easy to change the slide colors quickly.
    5. Well-crafted template with instant download facility.
    6. The best statistics slide for the PPT presentation.
    Advertisement

    You May Also Like These PowerPoint Templates

    Add to Wishlist
    Download
    AI Customize
    Four colored books stacked vertically, with corresponding progress bars and icons on the right showing percentages.
    Add to Wishlist
    Download
    AI Customize
    Four concentric circles in green, teal, red, and yellow, representing market levels with labels on the right.
    Add to Wishlist
    Download
    AI Customize
    Business analysis layout with three numbered hexagon steps and a photo of a business meeting on a dark blue background.
    Add to Wishlist
    Download
    AI Customize
    Slide deck outlining the performance evaluation process, with icons and hexagonal shapes depicting key steps.
    Add to Wishlist
    Download
    AI Customize
    Financial analysis chart displaying production and sales growth from 2016 to 2019 on a red toned background.
    Add to Wishlist
    Download
    AI Customize
    Force field analysis slide displaying driving forces on the left and restraining forces on the right with problem statement.
    Add to Wishlist
    Download
    AI Customize
    A blue and gray SWOT matrix displaying the strategy details with a descriptive box on the right.
    Free
    Add to Wishlist
    Download
    AI Customize
    Business analysis diagram with a hexagon featuring a magnifying glass icon, connected to six colored steps on both sides.
    Add to Wishlist
    Download
    AI Customize
    Slide featuring five colorful cylindrical bar charts labeled with data analytics categories with percentages from 23% to 75%.
    Add to Wishlist
    Download
    AI Customize
    Colorful horizontal layout with arrows in turquoise, purple, red, and orange, showcasing a value chain structure.
    Add to Wishlist
    Download
    AI Customize
    Four rectangular blocks in purple, red, blue, and green displaying text with circular icons on the left.
    Add to Wishlist
    Download
    AI Customize
    Slide with three green sections in a vertical layout, each featuring icons for traffic, behavior tracking, and optimization.
    Add to Wishlist
    Download
    AI Customize
    Four colored analysis circles with icons of data charts, computer screen, bar graphs, and gears, analysis with caption areas.
    Add to Wishlist
    Download
    AI Customize
    Stunning Analysis Infographics PPT And Google Slides
    Add to Wishlist
    Download
    AI Customize
    Situation analysis slide featuring a central magnifying glass over a circular diagram with four colorful segments around it.
    Add to Wishlist
    Download
    AI Customize
    Circular infographic with five colored segments surrounding a central gear icon for a analyis coverage pit fall.
    Add to Wishlist
    Download
    AI Customize
    Slide featuring icons representing analysis elements magnifying glass, light bulb, pencil, and money with placeholder text.
    Add to Wishlist
    Download
    AI Customize
    Simple Business analytics slide showcasing four numbered options alongside a presenter graphic.