Attractive Business Analytics Templates and Themes

Business analytics slide displaying a world map with six marked markets and a line chart for monthly data analysis.
P.ID : 33207
    222 views
    9 Downloads
    Get Custom Slides by Experts
    Instantly Access Templates in PowerPoint

    Business Analytics Presentation Slides


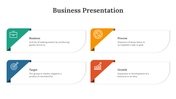
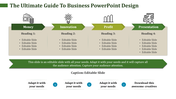
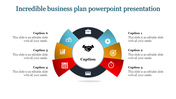
    Business Analytics PowerPoint Template and Google Slides Themes empowers your presentations with a dynamic Map design and 5 cutting-edge marketing strategies. Featuring graph visualizations and three nodes with icons, captions, and text areas, this tool is perfect for analysts, marketers, and executives.

    Note that Business Analytics is not just about numbers; it's a strategic approach to data, enabling companies to make informed decisions. Transform complex data into compelling stories, guiding stakeholders through insights effortlessly.

    Redefined for today's data landscape, this template sharpens your data narrative with crisp visuals and a user-friendly interface, making it ideal for pitch decks, reports, and strategy meetings. Download now and improve your data storytelling!

    Features of the Template

    • 100 % customizable slides.
    • The   slide show is in 4:3, 16:9, zip format.
    • There is powerful connectivity with Google Slides and PowerPoint.
    • It is simple and quick to alter the slide's color.
    • An efficient template that can be easily accessed immediately.
    • Well-crafted template with an instant download facility.
    Advertisement

    You May Also Like These PowerPoint Templates

    Add to Wishlist
    Download
    AI Customize
    Six pie analysis charts in blue, red, orange, green, teal, and purple, displaying percentages from 15% to 90%.
    Add to Wishlist
    Download
    AI Customize
    A colorful risk analysis matrix slide chart, displaying low, medium, high, and extreme risk levels in a grid format.
    Add to Wishlist
    Download
    AI Customize
    Linear timeline showing red triangular nodes connected by dots, each node containing an icon and caption.
    Add to Wishlist
    Download
    AI Customize
    Attractive Business Analytics PowerPoint Template Design
    Add to Wishlist
    Download
    AI Customize
    A person working on a laptop with analysis data, alongside bar charts with percentage and text box, on a gray background.
    Add to Wishlist
    Download
    AI Customize
    Colorful SOAR Model PowerPoint slide with circles and icons with strength, opportunities, aspirations, and results.
    Add to Wishlist
    Download
    AI Customize
    Circular waffle chart with segmented colored sections in blue, orange, teal, and red, representing percentage values.
    Add to Wishlist
    Download
    AI Customize
    Analytics slide with line graph, pie chart, and statistics showing 13M views, 13M active subscribers, and 991K subscribers.
    Add to Wishlist
    Download
    AI Customize
    Financial slide with golden globes for two countries, featuring coin stacks next to one, with blue percentage bars below.
    Add to Wishlist
    Download
    AI Customize
    Performance PPT And Google Slides Themes For Your Needs
    Add to Wishlist
    Download
    AI Customize
    Market analysis PowerPoint slide featuring a pie chart with labeled segments and captions for each market category.
    Add to Wishlist
    Download
    AI Customize
    Analysis presentation slide showing a technology growth chart with percentage values and icons with placeholder text.
    Free
    Add to Wishlist
    Download
    AI Customize
    Best Scenario Analysis Presentation Template Slides
    Add to Wishlist
    Download
    AI Customize
    Financial analysis slide with a bold 40% statistic, a financial overview section, and a businessperson pointing.
    Add to Wishlist
    Download
    AI Customize
    Buy Affordable Data Analysis Presentation Template
    Add to Wishlist
    Download
    AI Customize
    Customize Feasibility Study PPT And Google Slides Themes
    Add to Wishlist
    Download
    AI Customize
    Analysis PPT slide with four colorful text boxes and unique icons for each stage of the process with captions.