MILESTONE 🌟 5 Million+ creative minds trust SlideEgg! Grab 80% OFF

Free - Business Analytics PowerPoint Templates and Google Slides

Free
A business analytics PowerPoint slide featuring four sections, each with icons and placeholder text.
P.ID : 37415
    355 views
    157 Downloads
    Get Custom Slides by Experts
    Instantly Access Templates in PowerPoint

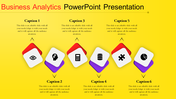
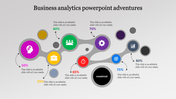
    Business Analytics Presentation Slide

    Welcome to the exciting world of business analytics! With data as your pool, you can gain valuable ideas to make it real that drive success. In today's fast-paced business environment, using the power of data is crucial to stay ahead of the competition. From identifying patterns to predicting trends, business analytics empowers you to optimize operations, enhance strategies, and boost profitability. Get ready to captivate your audience with a visually appealing template!

    Features of the template

    • 100% customizable slides and easy to download.
    • Slides are available in different nodes & colors.
    • The slides contain 16:9 and 4:3 formats.
    • Easy to change the colors quickly.
    • It is a well-crafted template with an instant download facility.
    • Highly compatible with both PowerPoint and Google Slides.
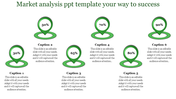
    • An elegant slide with four captions.
    • A standard template with a pleasant color.
    Advertisement

    You May Also Like These PowerPoint Templates

    Add to Wishlist
    Download
    AI Customize
    Analytics slide with line graph, pie chart, and statistics showing 13M views, 13M active subscribers, and 991K subscribers.
    Add to Wishlist
    Download
    AI Customize
    Analysis presentation slide showing a technology growth chart with percentage values and icons with placeholder text.
    Free
    Add to Wishlist
    Download
    AI Customize
    Best Scenario Analysis Presentation Template Slides
    Add to Wishlist
    Download
    AI Customize
    Buy Affordable Data Analysis Presentation Template
    Add to Wishlist
    Download
    AI Customize
    Analysis PPT slide with four colorful text boxes and unique icons for each stage of the process with captions.
    Add to Wishlist
    Download
    AI Customize
    Yellow pie chart divided into Analysis 1, 2, and 3 segments, focused by a black magnifying glass icon.
    Add to Wishlist
    Download
    AI Customize
    Graph with three numbered curves in green, orange, and red, with corresponding text on the right.
    Free
    Add to Wishlist
    Download
    AI Customize
    Blue themed slide with two square icons on tilted diamonds and two rectangular caption boxes on the right.
    Free
    Add to Wishlist
    Download
    AI Customize
    Analysis PPT slide showing a phone with a checklist and icons with multiple captions with text descriptions.
    Free
    Add to Wishlist
    Download
    AI Customize
    Four triangular icons in yellow, pink, purple, and red, showing percentages, with gray caption boxes below.
    Add to Wishlist
    Download
    AI Customize
    Slide featuring a five step process for performance with matching icons for each phase.
    Free
    Add to Wishlist
    Download
    AI Customize
    Analysis presentation template with six sections arranged in a yellow circle, each featuring an icon and caption.
    Add to Wishlist
    Download
    AI Customize
    Analysis PowerPoint slide featuring a hexagonal internal analysis core and six colorful surrounding icons with labels.
    Add to Wishlist
    Download
    AI Customize
    Colorful pie chart with a man holding a pencil, surrounded by directional arrows, symbolizing analysis and decision making.
    Add to Wishlist
    Download
    AI Customize
    Slide deck featuring multiple analysis templates with colorful layouts, charts, and icons for data representation.
    Add to Wishlist
    Download
    AI Customize
    Performance template with four linked circles labeled from finance to business processes, each with bullet points and icons.
    Add to Wishlist
    Download
    AI Customize
    Colorful circular analysis template featuring six sections with icons growth, target, people, settings, data, and analytics.
    Add to Wishlist
    Download
    AI Customize
    Blue infographic with location pins displaying percentages for market analysis, arranged in a triangular layout.