Awesome Statistics PowerPoint And Google Slides Template


Creative Statistics PowerPoint Template
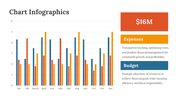
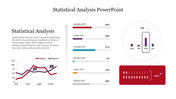
Statistics, as the science of collecting, analyzing, interpreting, and presenting data, is integral to understanding patterns, trends, and relationships in datasets. Using methods such as descriptive statistics to summarize data and inferential statistics to draw conclusions plays an important role in research, decision-making, and problem-solving in fields as diverse as business, health, and social sciences. By providing quantitative insights, statistics facilitate informed decision-making, policy formulation, and performance evaluation, assisting in the analysis of market trends, intervention effectiveness evaluation, and survey response analysis. Professionals, researchers, educators, researchers, and students can use this template to create impactful presentations on statistical analysis, research findings, or data-driven insights. With customizable templates featuring charts, graphs, tables, and charts, users can effectively visualize data and communicate key findings, tailoring the template to their specific content needs and presentation objectives. This rich template serves as a valuable tool for academic lectures, business presentations, research conferences and data analysis workshops, empowering presenters to effectively communicate statistical concepts, insights and results, thereby improving engagement.
Features of this template
- 100% customizable slides and easy to download.
- The slide contains 16:9 and 4:3 formats.
- Easy to change the colors of the slide quickly.
- Highly compatible with PowerPoint and Google Slides.


You May Also Like These PowerPoint Templates
Add to Wishlist
Download
Edit

Add to Wishlist
Download
Edit


Add to Wishlist
Download
Edit

Add to Wishlist
Download
Edit

Add to Wishlist
Download
Edit

Add to Wishlist
Download
Edit

Add to Wishlist
Download
Edit

Add to Wishlist
Download
Edit

Add to Wishlist
Download
Edit

Add to Wishlist
Download
Edit

Add to Wishlist
Download
Edit

Add to Wishlist
Download
Edit

Add to Wishlist
Download
Edit


Add to Wishlist
Download
Edit


Add to Wishlist
Download
Edit

Add to Wishlist
Download
Edit

Add to Wishlist
Download
Edit
