Editable Statistics Presentation PowerPoint Template

Illustration of people analyzing charts on large screens, with text on the right side.
P.ID : 63605
    828 views
    178 Downloads
    Get Custom Slides by Experts
    Instantly Access Templates in PowerPoint

    Practical Statistics Presentation PPT Template

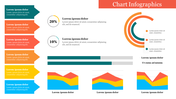
    Get our Statistics Presentation PowerPoint Template to illustrate the business idea and task to the audience. This template will help you to analyze the business Statistic report. This template is mainly used in marketing meetings. In addition, this Statistics Presentation PowerPoint Template gives an overall picture of how the plan goes and what could be done to enhance your business. It is a multicolor template with three text areas. Each icon has captions to add users' information. In addition, Our users can choose any slide from the Statistics plan PPT slides. This template is 100% editable, and it is an easily readable and acceptable template.

    Features of this template

    • It is a pre-built design to save time. 
    • 100% Customizable (shape color, size & text)
    • This template has a blue theme
    • Drag and drop image placeholder
    • Huge Collections of business slides to impress your audience
    • It supports an aspect ratio of 16:9 and 4:3 format
    Advertisement

    You May Also Like These PowerPoint Templates

    Add to Wishlist
    Download
    AI Customize
    Chart presentation template showing statistics for total clients, projects, and earnings with bar graphs.
    Free
    Add to Wishlist
    Download
    AI Customize
    PPT slide with a line chart showing monthly data and two pie charts for quarterly breakdown.
    Add to Wishlist
    Download
    AI Customize
    Slide with three donut shaped percentage charts showing 70%, 50%, and 90%, with corresponding captions beneath each.
    Add to Wishlist
    Download
    AI Customize
    Horizontal progress bars in red and blue, labeled with percentages, along with four labeled stages below.
    Add to Wishlist
    Download
    AI Customize
    Illustration of people analyzing charts on large screens, with text on the right side.
    Add to Wishlist
    Download
    AI Customize
    A colorful statistics slide featuring various charts including a world map, bar graphs, and a pie chart with text area.
    Add to Wishlist
    Download
    AI Customize
    Statistics slide with bar charts, line graphs, and progress indicators showing mobile users and social media budgets.
    Add to Wishlist
    Download
    AI Customize
    Diffusion model curve divided into five colored sections in yellow, pink, teal, blue, and orange, with percentages.
    Add to Wishlist
    Download
    AI Customize
    Statistics slide showing four bar charts with monthly data for April to July, including numerical values and icons.
    Add to Wishlist
    Download
    AI Customize
    Astounding Inferential Statistics PPT And Google Slides
    Free
    Add to Wishlist
    Download
    AI Customize
    Colorful statistics slide featuring various charts and graphs, including bar graphs, pie charts, and gender icons.
    Add to Wishlist
    Download
    AI Customize
    Statistics template featuring a bar chart and line graph, with placeholder text areas for detailed data descriptions.
    Free
    Add to Wishlist
    Download
    AI Customize
    Data statistics template featuring bar graphs, percentages, and text sections for detailed analysis with caption areas.
    Add to Wishlist
    Download
    AI Customize
    Four interlocked green and black squares with business icons, positioned alongside labeled captions.
    Add to Wishlist
    Download
    AI Customize
    A data statistics PowerPoint template displaying a chart with monthly trends and comparisons between regions.