Innovative Business Statistics PowerPoint And Google Slides

Impressive Business Statistics PowerPoint Template
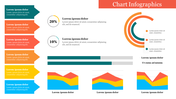
Business statistics involves the use of statistical techniques to analyze and interpret data related to various aspects of business operations, including sales, marketing, finance, and operations. Involves collecting, organizing, summarizing and presenting data to derive insights, identify trends and make informed business decisions. Business statistics play an important role in predicting future trends, evaluating performance, mitigating risks and improving processes to achieve organizational objectives. By using statistical tools and methods, businesses can gain valuable insights into consumer behavior, market trends, and competitive dynamics that help them develop effective strategies and increase growth. Business professionals, analysts, managers, consultants, and students can benefit from this template to create informative presentations on business statistics concepts, methods, and insights. Slide Deck offers customizable templates with charts, graphs, tables, and visual aids to effectively communicate statistical analysis findings, allowing users to tailor content to their specific needs and objectives. This template serves as a valuable resource for presenting business analysis reports, market research findings, financial performance analysis, and strategic planning presentations, and empowers providers to facilitate data-driven decision-making in business environments.
Features of this template
- 100% customizable slides and easy to download.
- The slide contains 16:9 and 4:3 formats.
- Easy to change the colors of the slide quickly.
- Highly compatible with PowerPoint and Google Slides.


You May Also Like These PowerPoint Templates
Add to Wishlist
Download
AI Customize

Add to Wishlist
Download
AI Customize


Add to Wishlist
Download
AI Customize

Add to Wishlist
Download
AI Customize

Add to Wishlist
Download
AI Customize

Add to Wishlist
Download
AI Customize

Add to Wishlist
Download
AI Customize

Add to Wishlist
Download
AI Customize

Add to Wishlist
Download
AI Customize

Add to Wishlist
Download
AI Customize

Add to Wishlist
Download
AI Customize

Add to Wishlist
Download
AI Customize

Add to Wishlist
Download
AI Customize


Add to Wishlist
Download
AI Customize


Add to Wishlist
Download
AI Customize

Add to Wishlist
Download
AI Customize

Add to Wishlist
Download
AI Customize
