Effective Statistics Slide Template Presentation PPT


Unique Statistics Slide Template Presentation PPT
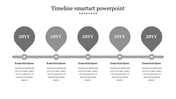
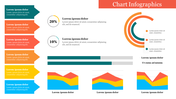
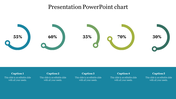
Get this statistics slide template; it is about the discipline that concerns the collection, organization, analysis, and presentation of data. It is a statistic infographic that includes many other visual representations of data. You can try this statistical infographic slide to present it to your audience in the most effective way.
About the template:
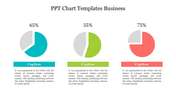
Grab this statistics slide template that contains the white background that helps to highlight the template look brighter when you present. It has four different icons in circles with a percentage level for various months. The template contains the editable texts you can modify and add additional information. And you can customize the background of the slide and animate it with images and texts.
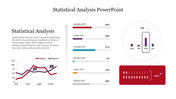
Download these statistics slides to give a brief account of information through infographics. And try our other slide of statistical analysis PowerPoint from SlideEgg.
Features of the slide:
1.100% customizable slides and easy to download.
2. Slides available in different nodes & colors.
3. The slides contained 16:9 and 4:3 formats.
4. Easy to change the slide colors quickly.
5. Well-crafted template with instant download facility.
6. The effective statistics slide for the presentation.


You May Also Like These PowerPoint Templates
Add to Wishlist
Download
Edit

Add to Wishlist
Download
Edit


Add to Wishlist
Download
Edit

Add to Wishlist
Download
Edit

Add to Wishlist
Download
Edit

Add to Wishlist
Download
Edit

Add to Wishlist
Download
Edit

Add to Wishlist
Download
Edit

Add to Wishlist
Download
Edit

Add to Wishlist
Download
Edit

Add to Wishlist
Download
Edit

Add to Wishlist
Download
Edit

Add to Wishlist
Download
Edit


Add to Wishlist
Download
Edit


Add to Wishlist
Download
Edit

Add to Wishlist
Download
Edit

Add to Wishlist
Download
Edit
