Astounding Inferential Statistics PPT And Google Slides

Pack of 13 slides
P.ID : 71057
Advertisement
508 views
89 Downloads
Get Custom Slides by Experts
Instantly Access Templates in PowerPoint

Inferential Statistics Presentation Slides


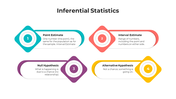
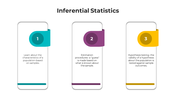
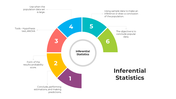
In the intricate tapestry of Statistical analysis, Inferential Statistics emerges as a central thread. Beyond the vivid portrayals of Descriptive Statistics, it delves deeper, interpreting and predicting based on select samples. This realm, rich with Hypothesis testing and Regression analysis, offers tools to forecast, assess uncertainties, and validate assumptions. Leveraging probability theory, it discerns underlying patterns, unlocking insights once obscured. Tailored for everyone from students to seasoned researchers, this template streamlines these sophisticated processes. Each slide is crafted to clarify, turning abstract concepts like Regression analysis into tangible takeaways. Presenters, you're equipped with a robust tool that not only personalizes to reflect your unique perspective but also encapsulates dense statistical topics with elegance. Harness this template, captivating audiences and guiding them through the fascinating corridors of Inferential Statistics. Elevate your narrative, inspire curiosity, and kindle a passion for deep-dived statistical exploration.


Features of the templates:


  • 100% customizable slides and easy to download.
  • Slides are available in different nodes & colors.
  • The slide contained 16:9 and 4:3 formats.
  • Easy to change the slide colors quickly.
  • It is a well-crafted template with an instant download facility.
  • Highly compatible with PowerPoint and Google Slides.

You May Also Like These PowerPoint Templates

Free
Add to Wishlist
Download
AI Customize
Use Timeline PowerPoint 2007 Slide Template Design
Free
Add to Wishlist
Download
AI Customize
Timeline PowerPoint slide for 2017 to 2021 with captions and green circular milestone markers on a white backdrop.
Free
Add to Wishlist
Download
AI Customize
Progressive green timeline with six circular nodes, each indicating a year '20XX,' supported by placeholder text in sections.
Add to Wishlist
Download
AI Customize
PowerPoint timeline slide with annual milestones from 2015 to 2024 using arrows and year labels.
Add to Wishlist
Download
AI Customize
Structured timeline with orange highlighted boxes for each year, featuring icons and text in a 3x3 grid.
Free
Add to Wishlist
Download
AI Customize
Timeline design with gray, green, blue, pink, orange, and yellow shapes and icons, connected by lines.
Free
Add to Wishlist
Download
AI Customize
Timeline template displaying six sequential steps, each represented by a colored circle with dashed lines and upward arrows.
Add to Wishlist
Download
AI Customize
Timeline graphic split into three sections for years, each with blue calendar visuals showing specific months and days.
Add to Wishlist
Download
AI Customize
Gray timeline template featuring six circular icons with dotted connections, representing different milestones.
Free
Add to Wishlist
Download
AI Customize
Find the Best PowerPoint Timeline Template Microsoft
Add to Wishlist
Download
AI Customize
Business slide with three pie charts in teal, green, and red showing percentages and captions below.
Add to Wishlist
Download
AI Customize
Chart infographics with a variety of chart including pie chart, bar charts, line graphs, and area charts with a caption area.
Add to Wishlist
Download
AI Customize
PPT chart with five colorful percentage indicators displayed in curved circular segments, ranging from 30 to 70 percent.
Add to Wishlist
Download
AI Customize
Chart infographic comparing data with orange and blue bars, alongside expense and budget details on the right.
Add to Wishlist
Download
AI Customize
Chart presentation template showing statistics for total clients, projects, and earnings with bar graphs.
Free
Add to Wishlist
Download
AI Customize
PPT slide with a line chart showing monthly data and two pie charts for quarterly breakdown.
Add to Wishlist
Download
AI Customize
Slide with three donut shaped percentage charts showing 70%, 50%, and 90%, with corresponding captions beneath each.
Add to Wishlist
Download
AI Customize
Horizontal progress bars in red and blue, labeled with percentages, along with four labeled stages below.
Add to Wishlist
Download
AI Customize
Illustration of people analyzing charts on large screens, with text on the right side.
Add to Wishlist
Download
AI Customize
A colorful statistics slide featuring various charts including a world map, bar graphs, and a pie chart with text area.
Add to Wishlist
Download
AI Customize
Statistics slide with bar charts, line graphs, and progress indicators showing mobile users and social media budgets.
Add to Wishlist
Download
AI Customize
Diffusion model curve divided into five colored sections in yellow, pink, teal, blue, and orange, with percentages.
Add to Wishlist
Download
AI Customize
Statistics slide showing four bar charts with monthly data for April to July, including numerical values and icons.
Add to Wishlist
Download
AI Customize
Astounding Inferential Statistics PPT And Google Slides
Free
Add to Wishlist
Download
AI Customize
Colorful statistics slide featuring various charts and graphs, including bar graphs, pie charts, and gender icons.
Add to Wishlist
Download
AI Customize
Statistics template featuring a bar chart and line graph, with placeholder text areas for detailed data descriptions.
Free
Add to Wishlist
Download
AI Customize
Data statistics template featuring bar graphs, percentages, and text sections for detailed analysis with caption areas.
Add to Wishlist
Download
AI Customize
Four interlocked green and black squares with business icons, positioned alongside labeled captions.
Add to Wishlist
Download
AI Customize
A data statistics PowerPoint template displaying a chart with monthly trends and comparisons between regions.