Buy Highest Quality Predesigned Chart Template PPT


Visualize Your Data with Our Chart PowerPoint Template
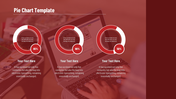
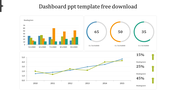
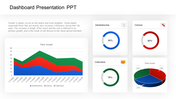
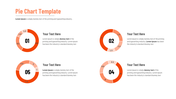
Charts are essential tools for presenting data clearly and concisely. They allow viewers to grasp complex information quickly, making them indispensable for business presentations, academic lectures, and reports. Our Chart PowerPoint Template and Google Slides Themes are designed to enhance your data presentation with clarity and professionalism. This template features three orange-themed circles, each representing different percentage levels. Every circle includes a caption text area, providing space to explain the data points effectively. The visually appealing design ensures your audience stays engaged and comprehends the information easily.
Ideal for financial reports, market analysis, and project updates, this template allows you to present your data with precision and style. The customizable elements enable you to tailor the charts to your specific needs, ensuring your presentation is both informative and visually striking. Elevate your data presentations with our Chart PowerPoint Template and Google Slides Themes, designed for impactful and professional communication.
Features of this template:
- 100 % customizable slides are easy to download.
- Slides are available in different nodes and colors.
- The slide was contained in 16:9 and 4:3 formats.
- It is easy to change the slide colors quickly.
- Well-crafted template with an instant download facility.
- The clear layout of this template will help you design a professional-looking presentation.
- The multi-color visuals on this slide will make your presentation eye-catching.


You May Also Like These PowerPoint Templates

Add to Wishlist
Download
Edit

Add to Wishlist
Download
Edit

Add to Wishlist
Download
Edit

Add to Wishlist
Download
Edit

Add to Wishlist
Download
Edit

Add to Wishlist
Download
Edit

Add to Wishlist
Download
Edit

Add to Wishlist
Download
Edit

Free
Add to Wishlist
Download
Edit


Add to Wishlist
Download
Edit

Add to Wishlist
Download
Edit

Add to Wishlist
Download
Edit

Add to Wishlist
Download
Edit

Add to Wishlist
Download
Edit

Add to Wishlist
Download
Edit
