Get Pie Chart PowerPoint Template With Red Background

A pie chart template with three circular charts representing each with text and icons beside them.
P.ID : 33977
    198 views
    8 Downloads
    Get Custom Slides by Experts
    Instantly Access Templates in PowerPoint

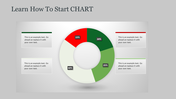
    Pie-Chart Presentation Template


    Are you tired of dull, uninspiring data presentations? Look no further! Our Pie Chart Templates are here to revolutionize your visual storytelling. Whether you’re a seasoned professional, a student, or anyone seeking impactful presentation materials, our templates have got you covered.

    Slide Description: 

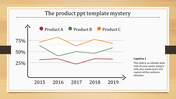
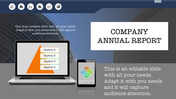
    Picture this: You’re in a boardroom, presenting critical data to stakeholders. The room buzzes with anticipation. Suddenly, your screen lights up with a vibrant, eye-catching pie chart. This slide represents a crucial aspect of your report. The colors pop, the labels are crystal clear, and your audience leans in, captivated. That’s the magic of our Pie Chart Templates.

    Our templates offer

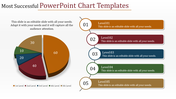
    Simplicity: No more tangled spreadsheets or confusing graphs. Our pie charts distill complex data into elegant visuals.
    Customizability: Tailor each slice to match your brand colors or thematic preferences. Adjust labels, fonts, and backgrounds effortlessly.
    Clarity: Whether you’re showcasing market share, budget allocation, or survey results, our templates ensure clarity at a glance.

    Collaborate with your team in real-time. Download your customized pie chart in high resolution. Use it in presentations, reports, or infographics.

    Features of the template:

    •  Slides are available in 4:3 & 16:9
    • Well-crafted template with instant download.
    • Get slides that are 100% customizable and easy to download
    Advertisement

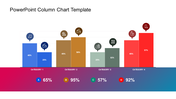
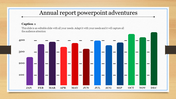
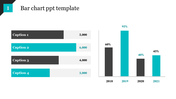
    You May Also Like These PowerPoint Templates

    Add to Wishlist
    Download
    AI Customize
    Gantt chart with a task breakdown, progress percentages, and a status table for project planning and execution.
    Free
    Add to Wishlist
    Download
    AI Customize
    Line chart with data points marked by blue squares and black dots, displaying values from 2006 to 2014.
    Add to Wishlist
    Download
    AI Customize
    Gantt chart with colorful horizontal bars spanning from January to June, representing project timelines and milestones.
    Free
    Add to Wishlist
    Download
    AI Customize
    PowerPoint slide with a bar chart showcasing three data series for different examples.
    Add to Wishlist
    Download
    AI Customize
    Chart layout with stacked bar graphs in red, yellow, green, and teal representing A1 to A8, with captions above.
    Add to Wishlist
    Download
    AI Customize
    Slide showing a bar chart with values for 2017, 2018, 2019, and 2020, with each year represented in different shades of blue.
    Add to Wishlist
    Download
    AI Customize
    Matrix chart with skill and will axes, divided into quadrants labeled high and low, with numbered circles and icons.
    Add to Wishlist
    Download
    AI Customize
    PowerPoint chart template displaying three donut charts with percentages and icons representing data categories.
    Add to Wishlist
    Download
    AI Customize
    Project plan Gantt chart template displaying tasks with milestones and progress percentages across months from Jan to Dec.
    Add to Wishlist
    Download
    AI Customize
    Bar chart presentation showing data from 2017 to 2020, with values 2.4, 4.4, 1.8, and 2.8, respectively.
    Add to Wishlist
    Download
    AI Customize
    Two vertical bar charts with three columns each, alongside captions with percentages in varying shades of orange.
    Free
    Add to Wishlist
    Download
    AI Customize
    Revenue analysis slide with bar chart, financial icon, and two descriptive sections for customer metrics.
    Add to Wishlist
    Download
    AI Customize
    3D pie chart with four color-coded segments red, orange, yellow, and brown displaying percentage values.
    Add to Wishlist
    Download
    AI Customize
    PPT template for an annual report featuring a bar graph comparing data across three time periods with color coded categories.
    Free
    Add to Wishlist
    Download
    AI Customize
    Bar chart slide with three stacked bars, each divided into segments with percentage labels, and a table on the right.
    Add to Wishlist
    Download
    AI Customize
    Gantt chart layout with five vertical milestone markers in blue, black, brown, green, and yellow.
    Free
    Add to Wishlist
    Download
    AI Customize
    3D bar graph with six green bars of varying heights, labeled placeholders, and a gray sidebar with text blocks.
    Free
    Add to Wishlist
    Download
    AI Customize
    Slide with four green donut charts and two horizontal bar graphs showing data comparisons across quarters and months.
    Free
    Add to Wishlist
    Download
    AI Customize
    Illustration of six red bars with corresponding percentages and a businesswoman standing beside them.
    Add to Wishlist
    Download
    AI Customize
    Company annual report slide with a gray and red graph displaying data with percentage values for investment and profit.