Gantt Chart Project Planner Template PowerPoint Slide

Gantt chart with a task breakdown, progress percentages, and a status table for project planning and execution.
P.ID : 34214
    805 views
    66 Downloads
    Get Custom Slides by Experts
    Instantly Access Templates in PowerPoint

    Excellent Gantt Chart Slide For Project Planner 

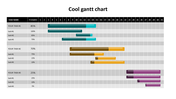
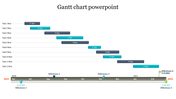
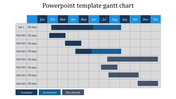
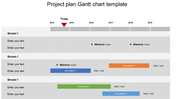
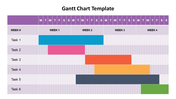
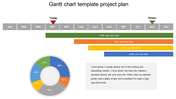
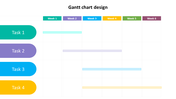
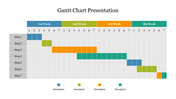
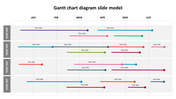
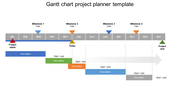
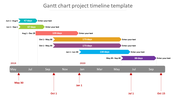
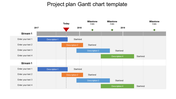
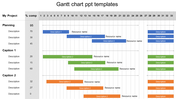
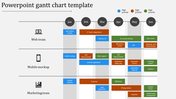
    A Gantt chart is the best project management tool to depict a project plan. It helps to display each task's starting date, ending date, and duration to make up a project. It also helps the project managers and team members simultaneously view the project's progress. Try our Gantt chart project planner slide from SlideEgg to make incredible presentations. It is a four-noded slide that has a well-designed chart with twelve months to show the starting, descriptions, and deadlines. It also includes a table to show the project status, resources, and risk levels. With this perfectly made slide, it will be easy to monitor the status of the projects. In addition, it is entirely editable according to your needs. Download now!

    Features of the template

    • 100% customizable slides and easy to download.
    • Slides are available in different nodes & colors.
    • The slide contains 16:9 and 4:3 formats.
    • Easy to change the colors of the slide quickly.
    • Well-crafted template with instant download facility.
    • Neatly organized project planner slide.
    Advertisement

    You May Also Like These PowerPoint Templates

    Add to Wishlist
    Download
    AI Customize
    Gantt chart with a timeline from 2014 to 2019, featuring colored bars and milestones in green, blue, and orange.
    Add to Wishlist
    Download
    AI Customize
    Slide with two donut charts displaying values and a text section on the right with a blurred background image.
    Add to Wishlist
    Download
    AI Customize
    Project timeline Gantt chart divided into two halves, showcasing task completion levels with gray progress bars.
    Add to Wishlist
    Download
    AI Customize
    Stacked column chart template displaying proportional data distribution across four categories using three series.
    Add to Wishlist
    Download
    AI Customize
    Colorful circular diagram slide illustrating four corporate strategy methods with labels and percentages.
    Add to Wishlist
    Download
    AI Customize
    Extended Gantt chart template covering July to December 2020 with placeholders for tasks and progress.
    Add to Wishlist
    Download
    AI Customize
    KWL chart with sections  in blue, green, and red, each column containing placeholder text.
    Add to Wishlist
    Download
    AI Customize
    Vertical bar chart in red shades, displaying yearly data from 2017 to 2020, with detailed labels on the right.
    Add to Wishlist
    Download
    AI Customize
    Dark themed layout featuring four pie charts with shaded segments, each displaying different percentages.
    Add to Wishlist
    Download
    AI Customize
    Green shaded bar chart displaying data from 2016 to 2021, with three numbered captions below.
    Add to Wishlist
    Download
    AI Customize
    Attractive Gantt Chart Sample PowerPoint Presentation
    Add to Wishlist
    Download
    AI Customize
    Gantt chart with seven tasks and their corresponding timeframes, shown in color-coded bars for each day in March 2021.
    Add to Wishlist
    Download
    AI Customize
    Sample  PPT Timeline Graphic PowerPoint Template
    Add to Wishlist
    Download
    AI Customize
    Timeline PowerPoint template with dates from September to November 2022 and colored milestones.
    Add to Wishlist
    Download
    AI Customize
    Innovative Gantt Timeline PowerPoint Template Designs
    Add to Wishlist
    Download
    AI Customize
    Timeline slide featuring a dark bar with numbered intervals, red and yellow markers, and green stars for milestones.
    Add to Wishlist
    Download
    AI Customize
    Gantt chart showing tasks in two categories with blue columns for priority, progress, dates, and responsible persons.