Awesome Project Gantt Chart Template and Google Slides Themes

 Canva
Canva

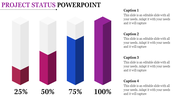
Project Gantt Chart Template and Google Slides Themes
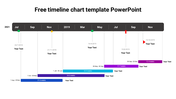
The Project Gantt Chart PowerPoint template and Google Slides theme offer a clean and organized layout for tracking project timelines and achievements. The template features a combination of white and grey colors, ensuring clarity and professionalism in your presentation. Each month column, from January to December, provides a structured timeline for your project.
Four flags pointing to the achievements serve as visual markers for significant milestones or completed tasks. This helps stakeholders easily identify key progress points throughout the project timeline.
Customize the template by adding your project details, tasks, and milestones to create a comprehensive Gantt chart that effectively communicates your project plan. Whether used for project management meetings, status updates, or client presentations, this template offers a clear and visually appealing way to showcase your project's progress and achievements. Grab it now!
Features of the template
- 100% customizable slides and easy to download.
- Slides are available in different nodes & colors.
- The slide contains 16:9 and 4:3 formats.
- It is easy to change the colors of the slide quickly.
- Well-crafted template with an instant download facility.


You May Also Like These PowerPoint Templates
Add to Wishlist
Download
AI Customize

Add to Wishlist
Download
AI Customize

Add to Wishlist
Download
AI Customize

Add to Wishlist
Download
AI Customize

Add to Wishlist
Download
AI Customize

Add to Wishlist
Download
AI Customize

Add to Wishlist
Download
AI Customize

Add to Wishlist
Download
AI Customize

Free
Add to Wishlist
Download
AI Customize


Add to Wishlist
Download
AI Customize

Add to Wishlist
Download
AI Customize

Add to Wishlist
Download
AI Customize

Add to Wishlist
Download
AI Customize

Add to Wishlist
Download
AI Customize


Add to Wishlist
Download
AI Customize

Add to Wishlist
Download
AI Customize

Add to Wishlist
Download
AI Customize

Add to Wishlist
Download
AI Customize
