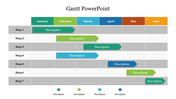
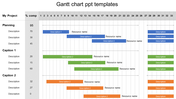
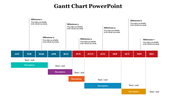
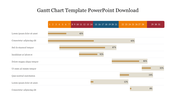
Effective Gantt Chart Template Weekly Presentation Slide

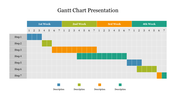
Gantt Chart Weekly Presentation Slide
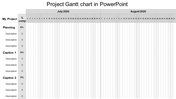
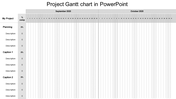
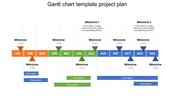
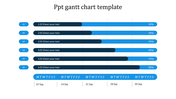
A weekly Gantt chart is a visual project management tool used to plan, schedule, and track tasks over a week. It is a horizontal bar chart that provides a clear view of the tasks that need to be completed, their start and end dates, and their progress. Weekly Gantt charts help ensure that projects are completed on time and within budget by highlighting potential delays or bottlenecks. They also help teams collaborate effectively by providing a shared understanding of project timelines and responsibilities. This presentation will be a perfect match if you want to explain what Gantt chart analysis is.
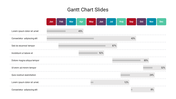
Features of the template:
- 100% customizable slides and easy to download.
- The slide contained 16:9 and 4:3 formats.
- Well-crafted template with an instant download facility.
- Highly Compatible with PowerPoint and Google Slides.
- This slide has a colorful design pattern.
- Easy to change the slide's colors.


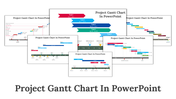
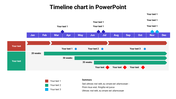
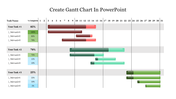
You May Also Like These PowerPoint Templates
Add to Wishlist
Download
AI Customize

Add to Wishlist
Download
AI Customize

Add to Wishlist
Download
AI Customize

Add to Wishlist
Download
AI Customize

Add to Wishlist
Download
AI Customize

Add to Wishlist
Download
AI Customize

Add to Wishlist
Download
AI Customize

Add to Wishlist
Download
AI Customize

Add to Wishlist
Download
AI Customize

Add to Wishlist
Download
AI Customize

Add to Wishlist
Download
AI Customize

Add to Wishlist
Download
AI Customize

Add to Wishlist
Download
AI Customize

Add to Wishlist
Download
AI Customize

Add to Wishlist
Download
AI Customize

Add to Wishlist
Download
AI Customize

Add to Wishlist
Download
AI Customize

Add to Wishlist
Download
AI Customize

Add to Wishlist
Download
AI Customize

Add to Wishlist
Download
AI Customize
