Free - Gantt Chart Template Project Plan And Google Slides

Free
Gantt chart plan template showing tasks across months with a colorful circular pie chart and matching bars on theright.
P.ID : 34215
    1.3K+ views
    417 Downloads
    Get Custom Slides by Experts
    Instantly Access Templates in PowerPoint

    Monthly Gantt Chart Template Project Plan 


    This Gantt chart template project plan is a clear, concise, visual means of viewing your project schedule. It keeps you organized in getting things done as planned.

    Slide Design:

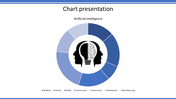
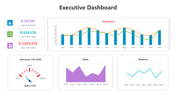
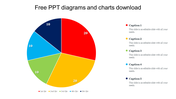
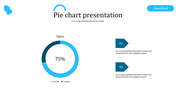
    This template has been set up to include a series of informative charts that enable you to get a detailed overall picture of your project. There is an open circular pie chart, segmented into six color-coded wedges, showing various project phases or tasks. The line chart plots a relationship across the 12 months, with start and end flags to help indicate a timescale of your project. Four color-coded lines extend from the pie chart to the timeline, easily depicting how each phase of the project fits into the overall schedule.

    Who can use this template? 

    The template is useful for project managers, team leaders, or anyone who needs to visually feel project progress and display it over time.

    Download this template today and be more in line with your project schedule.

    Features of the template


    • 100% customizable slides and easy to download.
    • The slides contain 16:9 and 4:3 formats.
    • Easy to change the colors quickly.
    • It is a well-crafted template with an instant download facility.
    • It is a 100% pre-designed slide.
    • The slide holds vibrant colors.
    Advertisement

    You May Also Like These PowerPoint Templates

    Add to Wishlist
    Download
    AI Customize
    Executive dashboard slide with a gauge displaying performance across different levels, labeled three sections.
    Free
    Add to Wishlist
    Download
    AI Customize
    Green and black area chart with a star shaped yellow badge and four circular icons with text below.
    Add to Wishlist
    Download
    AI Customize
    Marketing KPI template with three circular icons, and bar and line charts in blue, gray, and green below.
    Free
    Add to Wishlist
    Download
    AI Customize
    Creative infographic with a curved orange graph divided into four steps, each with an icon and label.
    Add to Wishlist
    Download
    AI Customize
    Bar chart with green hues, showing data for six categories, with side status boxes and light text.
    Add to Wishlist
    Download
    AI Customize
    Creative PowerPoint slide with two lines on a chart yellow and red with a green dot marking the highest point on the line.
    Free
    Add to Wishlist
    Download
    AI Customize
    Three column layout with blue megaphone, orange lightbulb, and red envelope icons on a beige background.
    Add to Wishlist
    Download
    AI Customize
    3D triangular bar chart in yellow, orange, and blue shades showing monthly data for four categories, on a dark background.
    Free
    Add to Wishlist
    Download
    AI Customize
    A simple chart slide with overlaid blue, green, orange, and yellow circles of varying sizes with a graph and captions.
    Add to Wishlist
    Download
    AI Customize
    Bar chart slide showcasing yearly data from 2016 to 2021, with three distinct bar categories and values in shades of purple.
    Add to Wishlist
    Download
    AI Customize
    3D cone chart with orange, pink, and blue segments, placed on a gray platform with a white background.
    Add to Wishlist
    Download
    AI Customize
    Bar chart slide showing the performance of four products with categories like sales growth, market share, and profit margin.
    Add to Wishlist
    Download
    AI Customize
    Slide displaying two pie charts with quarter wise performance data, along with performance percentages at the bottom.
    Add to Wishlist
    Download
    AI Customize
    Slide featuring a businessman pointing at a board with a pie chart and two circular progress visuals in red and yellow.
    Add to Wishlist
    Download
    AI Customize
    Dashboard layout showing net worth value, asset categories in a pie chart, and bar chart for real estate comparisons.
    Add to Wishlist
    Download
    AI Customize
    PowerPoint slide showcasing a chart with project status trends and a progress bar for each year.
    Add to Wishlist
    Download
    AI Customize
    Slide featuring three green pie charts and a line graph below, illustrating data trends for different categories.