Best Gantt Chart PPT Template Presentation

Gantt chart PPT slide displaying tasks with start and end dates, milestones, and progress tracking for each month.
P.ID : 34216
    1.6K+ views
    178 Downloads
    Get Custom Slides by Experts
    Instantly Access Templates in PowerPoint

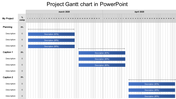
    Navigate Projects Seamlessly with our Gantt Chart PowerPoint Template


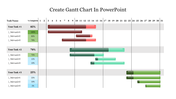
    Unleash the power of productivity with our dynamic Gantt Chart PowerPoint template Picture this: a vibrant canvas adorned with a spectrum of arrows, guiding you through months of seamless project management. This isn't just any presentation slide; it's a gateway to efficient planning and execution! Each arrow represents a task, color-coded for easy tracking. The month-by-month breakdown ensures nothing slips through the cracks. Whether you're overseeing a corporate initiative or organizing your semester schedule, this slide simplifies the complex, making it accessible to all.

    Business moguls strategizing their next move, students juggling assignments, and anyone craving clarity amidst chaos. Simply plug in your data, customize to your heart's content, and watch your plans unfold effortlessly. Don't hesitate! Take the first step towards unparalleled efficiency. Download now and embark on a journey of productivity like never before!

    Features of the template

    • 100% customizable slides and easy to download.
    • Slides are available in different colors
    • The slide has 4:3 and 16:9 formats.
    • Easy to change the slide colors quickly.
    • Appealing Presentation to impress an audience.
    • Create feature-rich slide presentations. 
    • An eye-pleasing color slide helps to give a catchy display.
    • Highly compatible with PowerPoint and Google Slides.
    Advertisement

    You May Also Like These PowerPoint Templates

    Add to Wishlist
    Download
    AI Customize
    Project overview dashboard template with area chart, line charts for time intervals, and percentage indicators.
    Add to Wishlist
    Download
    AI Customize
    Gradient peaks showing sales growth percentages in shades of blue and gray, with detailed text on the right dark sidebar.
    Add to Wishlist
    Download
    AI Customize
    Slide featuring a blue-toned pie chart representing sales revenue percentages, with captions areas for each segment.
    Add to Wishlist
    Download
    AI Customize
    A Gantt chart timeline highlighting milestones from January to December with a marker for today's date in May.
    Add to Wishlist
    Download
    AI Customize
    Row of pie charts with varying color schemes for data visualization each place diwth caption areas.
    Add to Wishlist
    Download
    AI Customize
    Dashboard chart displaying social media subscribers by gender, age, most read articles, and categories in 2019.
    Add to Wishlist
    Download
    AI Customize
    Three pie charts in red, yellow, and blue with percentage values, arranged horizontally with text below.
    Add to Wishlist
    Download
    AI Customize
    Six-month Gantt chart template spanning July to December 2020 with weekly divisions and task rows.
    Add to Wishlist
    Download
    AI Customize
    Five segment pie chart in orange, blue, red, green, and pink, each with number and connected with text areas.
    Free
    Add to Wishlist
    Download
    AI Customize
    Line chart in teal showing data points from 2013 to 2020 on a white background, with five icons listed on the right.
    Free
    Add to Wishlist
    Download
    AI Customize
    Histogram on the left and Pareto chart in pink and orange with cumulative line on the right.
    Free
    Add to Wishlist
    Download
    AI Customize
    Four blue pyramid shapes in ascending size, labeled with percentages, aligned over a horizontal gray bar.
    Free
    Add to Wishlist
    Download
    AI Customize
    Dashboard with a timeline bar chart in green and purple, labeled with milestones for savings and investments.
    Add to Wishlist
    Download
    AI Customize
    A pie chart featuring five segments, each labeled with percentages, surrounded by text on a blue background.
    Add to Wishlist
    Download
    AI Customize
    Dashboard showing from defect rate trends upto delivery time analysis in mixed orange and brown theme.
    Add to Wishlist
    Download
    AI Customize
    KPI slide with four semi circular gauges displaying metrics and overlapping colored circles showing numerical data.
    Add to Wishlist
    Download
    AI Customize
    KPI dashboard layout with bar charts, a gauge, captions, and target metrics on light gray background, organized in sections.
    Add to Wishlist
    Download
    AI Customize
    Slide with two donut charts displaying values and a text section on the right with a blurred background image.
    Add to Wishlist
    Download
    AI Customize
    Stacked column chart template displaying proportional data distribution across four categories using three series.