Gantt Chart PPT Templates and Google Slides Presentation

Gantt chart slide showing a project timeline with tasks categorized into colorful sections, represented by horizontal bars.
P.ID : 34194
    3.5K+ views
    458 Downloads
    Get Custom Slides by Experts
    Instantly Access Templates in PowerPoint

    Effect Slide To Present Your Project Plans


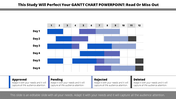
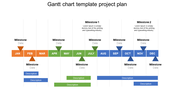
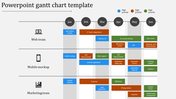
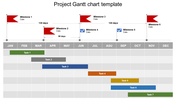
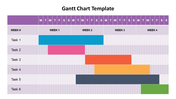
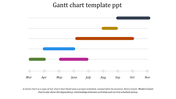
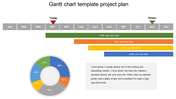
    Get our Gantt Chart Slides to track all plans with a colorful Bar Chart. Users can use this template to present their data, track their goals, and present business reports. Finally, users can use this template in project or business goal meetings. This template has a multicolor chart to present your project plans. Each text holder has different data, which are replaceable. The creative layout of this slide gives a modern look and feel. Our templates are 100% customizable and editable. In addition, our template is unique and simple. All Nodes are easy to edit, and you can easily change the colors and fonts. Find more Gantt Charts from SlideEgg!

    Features of the template

    • 100% customizable slides and easy to download.
    • Slides are available in different nodes & colors.
    • The slide contained 16:9 and 4:3 formats.
    • Easy to change the slide colors quickly.
    • Well-crafted template with instant download facility.
    • Easily understandable slide.
    Advertisement

    You May Also Like These PowerPoint Templates

    Add to Wishlist
    Download
    AI Customize
    Creative PowerPoint slide with two lines on a chart yellow and red with a green dot marking the highest point on the line.
    Free
    Add to Wishlist
    Download
    AI Customize
    Three column layout with blue megaphone, orange lightbulb, and red envelope icons on a beige background.
    Free
    Add to Wishlist
    Download
    AI Customize
    A simple chart slide with overlaid blue, green, orange, and yellow circles of varying sizes with a graph and captions.
    Add to Wishlist
    Download
    AI Customize
    3D cone chart with orange, pink, and blue segments, placed on a gray platform with a white background.
    Add to Wishlist
    Download
    AI Customize
    Bar chart slide showing the performance of four products with categories like sales growth, market share, and profit margin.
    Add to Wishlist
    Download
    AI Customize
    Slide featuring a businessman pointing at a board with a pie chart and two circular progress visuals in red and yellow.
    Add to Wishlist
    Download
    AI Customize
    Dashboard layout showing net worth value, asset categories in a pie chart, and bar chart for real estate comparisons.
    Add to Wishlist
    Download
    AI Customize
    PowerPoint slide showcasing a chart with project status trends and a progress bar for each year.
    Add to Wishlist
    Download
    AI Customize
    Slide featuring three green pie charts and a line graph below, illustrating data trends for different categories.
    Add to Wishlist
    Download
    AI Customize
    Colorful timeline PowerPoint chart illustrating shifts for various employees throughout the day with peak hours highlighted.
    Free
    Add to Wishlist
    Download
    AI Customize
    Business plan infographic with a four-quadrant layout labeled with sales strategies and a 3D pie chart on the right.
    Add to Wishlist
    Download
    AI Customize
    Four panel chart slide featuring a line, bar, and pie chart, each displaying data trends and comparisons.
    Free
    Add to Wishlist
    Download
    AI Customize
    Bar graph showing revenue and sales data for 3D Ocean, Web, Graphics, Video, and Design in a business plan presentation.
    Free
    Add to Wishlist
    Download
    AI Customize
    Green bar graph depicting growth over six months, with two gear icons and captions on the left.
    Add to Wishlist
    Download
    AI Customize
    Project dashboard slide with a compass design,  featuring four labeled captions, and an orange sidebar for text.
    Free
    Add to Wishlist
    Download
    AI Customize
    Chart slide with four interlinked circular diagrams, and two radar charts in blue and green at the bottom.
    Free
    Add to Wishlist
    Download
    AI Customize
    Pie chart with four segments in white and green on a dark patterned background, alongside a text box for description.
    Free
    Add to Wishlist
    Download
    AI Customize
    Pyramid infographic with four golden pyramids in ascending order, marked with percentages 10% to 40% on a dark base.