Gantt Chart Google Slides and PowerPoint Templates
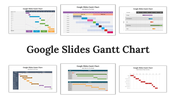

Gantt Chart Google Slides Presentation
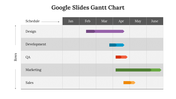
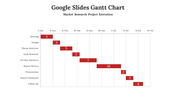
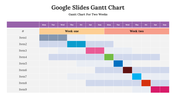
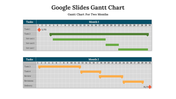
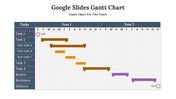
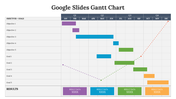
A Gantt chart is a project management tool that visualizes a project schedule over time. It displays tasks as horizontal bars on a timeline, with the start and end dates for each task. Gantt charts provide a clear overview of project progress, allowing project managers to track tasks, monitor deadlines, and manage resources effectively. They are often used in industries such as construction, engineering, and software development, but can be applied to any project that involves multiple tasks and deadlines. Overall, Gantt charts are a valuable tool for project managers seeking to optimize project planning and execution. Using this template can help you to keep your audience engaged and interested throughout your presentation.
Features of the template:
- 100% customizable slide and easy to download.
- The slide contained in 16:9 and 4:3 formats.
- This slide has a colorful design pattern.
- Highly compatible with PowerPoint and Google Slides.
- Drag and drop image placeholder.
- Well-crafted template with instant download facility.
- It has a simple and easily understandable layout.


You May Also Like These PowerPoint Templates
Add to Wishlist
Download
AI Customize

Add to Wishlist
Download
AI Customize

Add to Wishlist
Download
AI Customize

Add to Wishlist
Download
AI Customize

Add to Wishlist
Download
AI Customize

Add to Wishlist
Download
AI Customize

Add to Wishlist
Download
AI Customize

Add to Wishlist
Download
AI Customize

Add to Wishlist
Download
AI Customize

Add to Wishlist
Download
AI Customize

Add to Wishlist
Download
AI Customize

Add to Wishlist
Download
AI Customize

Add to Wishlist
Download
AI Customize

Add to Wishlist
Download
AI Customize

Add to Wishlist
Download
AI Customize

Add to Wishlist
Download
AI Customize

Add to Wishlist
Download
AI Customize

Add to Wishlist
Download
AI Customize

Add to Wishlist
Download
AI Customize

Add to Wishlist
Download
AI Customize

Add to Wishlist
Download
AI Customize

Add to Wishlist
Download
AI Customize

Free
Add to Wishlist
Download
AI Customize

Add to Wishlist
Download
AI Customize

Add to Wishlist
Download
AI Customize

Add to Wishlist
Download
AI Customize

Add to Wishlist
Download
AI Customize

Add to Wishlist
Download
AI Customize

Add to Wishlist
Download
AI Customize

Add to Wishlist
Download
AI Customize

Add to Wishlist
Download
AI Customize

Free
Add to Wishlist
Download
AI Customize

Add to Wishlist
Download
AI Customize

Add to Wishlist
Download
AI Customize

Add to Wishlist
Download
AI Customize

Add to Wishlist
Download
AI Customize
