Editable Gantt Chart PowerPoint And Google Slides

Gantt chart with colorful horizontal bars showing project tasks across months and milestones highlighted below.
P.ID : 3313
    1.8K+ views
    181 Downloads
    Get Custom Slides by Experts
    Instantly Access Templates in PowerPoint

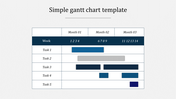
    Attractive Gantt Chart PowerPoint Template


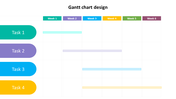
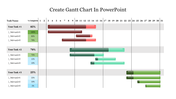
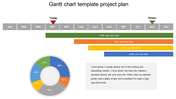
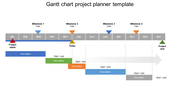
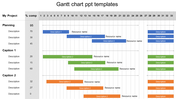
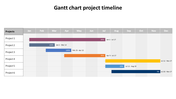
    Experience enhanced project management and clarity in your presentations with our Gantt Chart PowerPoint template. This tool is designed to deliver comprehensive visibility into project schedules and resource allocations, making it an invaluable asset for project managers, team leaders, and anyone involved in project planning and execution. By clearly displaying start and end dates alongside key project stages and dependencies, this template helps you maintain stringent control over your project timelines, ensuring all stakeholders are aligned and informed. Ideal for both novice and experienced presenters, the template's user-friendly design allows for easy customization to suit specific project needs. It enhances your ability to communicate complex project details effectively, encouraging better planning and execution strategies among your team. Download this Gantt Chart template today to transform your project presentations into more manageable, understandable, and actionable visual data. Elevate your project management skills and engage your audience with professional-grade tools designed to simplify complex information and drive successful project outcomes.

    Features of this Template


    • 100% customizable slides and easy to download.
    • The slide contains 16:9 and 4:3 formats.
    • Easy to change the colors of the slide quickly.
    • Highly compatible with PowerPoint and Google Slides.
    Advertisement

    You May Also Like These PowerPoint Templates

    Free
    Add to Wishlist
    Download
    AI Customize
    A detailed Gantt chart slide illustrating project timelines with tasks spanning different durations for 2021 and 2022.
    Free
    Add to Wishlist
    Download
    AI Customize
    Effective Gantt Chart PowerPoint Presentation Slide
    Free
    Add to Wishlist
    Download
    AI Customize
    Gantt chart with colored bars representing tasks for nine items over two weeks, displayed across a grid layout.
    Add to Wishlist
    Download
    AI Customize
    Gantt chart slide deck with colorful bars showing project schedules, tasks, and deadlines over weekly and monthly timelines.
    Add to Wishlist
    Download
    AI Customize
    Gantt chart slide displaying task schedules across a month with color coded task progress.
    Add to Wishlist
    Download
    AI Customize
    Color coded timeline chart slide showing tasks over 10 months, from june 2019 to february 2020, with labeled milestones.
    Add to Wishlist
    Download
    AI Customize
    A horizontal Gantt chart showing project timeline with colored bars for tasks and milestones labeled across the months.
    Free
    Add to Wishlist
    Download
    AI Customize
    Color-coded Gantt chart template for project management, displaying four phases across quarters with colorful text boxes.
    Add to Wishlist
    Download
    AI Customize
    Gantt chart with colored bars displaying tasks across months, showing project progress on a dark background.
    Free
    Add to Wishlist
    Download
    AI Customize
    Simple Gantt chart slide displaying task schedules across three months with each task's duration represented by colored bars.
    Add to Wishlist
    Download
    AI Customize
    Horizontal Gantt chart with colored bars showing different project phases across months from 2019 to 2020.
    Add to Wishlist
    Download
    AI Customize
    Gantt chart slide with horizontal gray task bars and percentage completion for months in a color coded header.
    Add to Wishlist
    Download
    AI Customize
    Color coded Gantt chart slide outlining a yearly project timeline with quarterly milestones and description boxes.
    Add to Wishlist
    Download
    AI Customize
    Gantt chart displaying task progress for seven steps, each represented by colored bars spanning from January to June.
    Add to Wishlist
    Download
    AI Customize
    Gantt chart slide showing a project timeline with tasks categorized into colorful sections, represented by horizontal bars.
    Add to Wishlist
    Download
    AI Customize
    Gantt chart template showing tasks with percentage completion values, organized along a thirty one days colored timeline.