Timeline Gantt chart in PowerPoint Template & Google Slides

 Canva
Canva
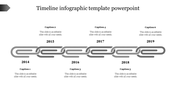
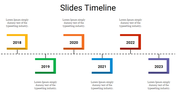
Timeline Gantt Chart Presentation Slide
A timeline gantt chart is a powerful tool that helps to visually present project timelines and schedules in a clear and concise manner. It is a type of bar chart that displays project tasks and activities over a specific period. The chart shows the start and end dates of each task, their duration, and their dependencies. This allows users to see the progress of a project at a glance and make adjustments as needed. This template is designed to provide users with an efficient and effective way to create professional-looking project timelines. With this template, users can efficiently communicate project timelines and progress to stakeholders, ensuring that everyone is on the same page and that the project is delivered successfully.
Features of the template
- 100% customizable slides and easy to download.
- Slides are available in different colors
- The slide has 4:3 and 16:9 formats.
- Easy to change the slide colors quickly.
- Appealing presentation to impress an audience.
- Create feature-rich slide presentations.
- Slides are compatible with Google slides.
- Perfect timeline Gantt chart layout.


You May Also Like These PowerPoint Templates

Add to Wishlist
Download
Edit

Add to Wishlist
Download
Edit

Add to Wishlist
Download
Edit

Add to Wishlist
Download
Edit


Add to Wishlist
Download
Edit

Add to Wishlist
Download
Edit

Add to Wishlist
Download
Edit

Add to Wishlist
Download
Edit


Add to Wishlist
Download
Edit


Add to Wishlist
Download
Edit

Add to Wishlist
Download
Edit

Add to Wishlist
Download
Edit


