Free - Best PowerPoint Gantt Chart Template

Free
Gantt chart slide with monthly timeline across three teams, using blue, orange, and green bars to indicate priority items.
P.ID : 35530
    1.7K+ views
    579 Downloads
    Get Custom Slides by Experts
    Instantly Access Templates in PowerPoint

    Great PowerPoint Gantt Chart Templates

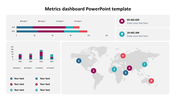
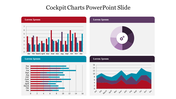
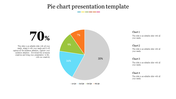
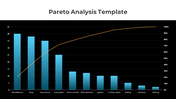
    Looking to create an impressive Gantt chart for your next PowerPoint presentation? Look no further! Our collection of PowerPoint Gantt chart templates is designed to make project planning and tracking a breeze. With a variety of visually appealing layouts and customizable features, you can showcase your project timeline with ease. These templates are perfect for project managers, team leaders, and professionals who want to present their plans in a clear and organized manner. Simply download the template, input your project data, and voila! Impress your audience with a stunning Gantt chart that visually represents your project's progress.

    Features of this template

    • 100% customizable slides and easy to download
    • Slides are available in different nodes & colors.
    • The slides contain 16:9 and 4:3 formats.
    • Easy to change the slide colors quickly.
    • Well-crafted template with an instant download facility.
    • Create a personalized and professional-looking presentation.
    • Engaging attributes are added.
    • Compatible with google slides and MS Word.
    Advertisement

    You May Also Like These PowerPoint Templates

    Add to Wishlist
    Download
    AI Customize
    Pricing Strategy chart slide highlighting four key areas from price to promotion with icons in a diamond layout.
    Add to Wishlist
    Download
    AI Customize
    Three outlined boxes in yellow, red, and green, each with circles labeled K, W, and L, at the bottom.
    Add to Wishlist
    Download
    AI Customize
    Timeline chart slide depicting four colored project phases with major milestones and key dates.
    Add to Wishlist
    Download
    AI Customize
    KPI dashboard template with six sections which includes charts, graphs, and numerical data.
    Add to Wishlist
    Download
    AI Customize
    KPI Infographics PowerPoint And Google Slides Themes
    Add to Wishlist
    Download
    AI Customize
    A project management dashboard slide featuring a table of test case data alongside visual graphs and planned progress.
    Add to Wishlist
    Download
    AI Customize
    A dynamic slide layout featuring a circular pie chart, with labeled segments and placeholder text.
    Add to Wishlist
    Download
    AI Customize
    Two line graphs comparing data trends with different colors, featuring seven data points on each chart.
    Add to Wishlist
    Download
    AI Customize
    Colorful circle chart depicting percentage distribution across four categories, with accompanying captions for each segment.
    Free
    Add to Wishlist
    Download
    AI Customize
    Four vertical panels in alternating blue and red colors, showing social media icons with pie charts at the bottom.
    Add to Wishlist
    Download
    AI Customize
    Colorful business analytics dashboard displaying bar graphs, line charts, and percentage indicators in a structured layout.
    Add to Wishlist
    Download
    AI Customize
    Stacked column chart with three categories, percentage labels, and circular step icons on both sides with percentage figures.
    Add to Wishlist
    Download
    AI Customize
    A stock chart with five vertical bars in orange and teal, representing financial data for a day period.
    Add to Wishlist
    Download
    AI Customize
    Line chart with labeled high and low points across a fluctuating path, illustrating peaks and troughs in data trends.
    Add to Wishlist
    Download
    AI Customize
    Dashboard layout with income, expenses, profit, and cash flow figures on the left, a project budget chart in the center.
    Add to Wishlist
    Download
    AI Customize
    Dashboard template with pink charts showing facebook and twitter activity, percentage rings, and a page growth graph.
    Add to Wishlist
    Download
    AI Customize
    Line chart template with two lines and labeled data points, along with caption blocks on the left.
    Add to Wishlist
    Download
    AI Customize
    A line graph showing a plot structure with key points marked by colored dots, representing key stages.