Editable Blank Chart Template For Presentation

Blank chart slide with a weekly layout from monday to sunday, featuring a grid for scheduling or organizing tasks.
P.ID : 56900
    246 views
    17 Downloads
    Get Custom Slides by Experts
    Instantly Access Templates in PowerPoint

    Editable Blank Chart Template For Presentation


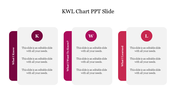
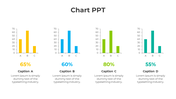
    Enhance your presentation with this attractive, bordered template featuring a unique design with glittering colors along the edges. This editable blank chart template includes tables, rows, and columns, making it versatile for creating themed presentation slides.

    This ready-made template is perfect for various uses, from organizing weekly to-do lists and creating timetables to preparing for exams. The included captions with day names add a practical touch, making it an ideal tool for structured planning. Use this editable blank chart template to bring a colorful and organized approach to your presentations!

    Features of this Template:


    • 100% customizable slides and easy to download.
    • Slides are available in different nodes & colors.
    • The slide contained 16:9 and 4:3 format.
    • Easy to change the slide colors quickly.
    • Well-crafted template with an instant download facility.
    • Dynamic Diagrams and nodes are inserted.
    • Bold and beautiful font styles
    Advertisement

    You May Also Like These PowerPoint Templates

    Add to Wishlist
    Download
    AI Customize
    Dashboard showing expense meters, global percentages on a map, and a bar chart visualizing data distribution.
    Add to Wishlist
    Download
    AI Customize
    Slide deck with KPI charts and graphs for business analysis, including financials, HR performance, and customer service.
    Add to Wishlist
    Download
    AI Customize
    KPI dashboard template with a line chart, progress indicators, and bar graphs showing different performance metrics.
    Free
    Add to Wishlist
    Download
    AI Customize
    Vertical bars in purple, blue, green, yellow, orange, and pink showing percentages, next to a businesswoman.
    Free
    Add to Wishlist
    Download
    AI Customize
    Project dashboard slide for electricity data with bar graphs showing units and amounts for different categories and months.
    Add to Wishlist
    Download
    AI Customize
    KPI dashboard template with progress bars, pie chart, bar graphs, and workload metrics in a clean blue theme.
    Add to Wishlist
    Download
    AI Customize
    Dashboard slide showing business performance, including technology, accessibility, and security scores with activity graphs.
    Free
    Add to Wishlist
    Download
    AI Customize
    Dashboard with four sections showing charts, icons, and metrics in purple, red, green, and teal.
    Free
    Add to Wishlist
    Download
    AI Customize
    KPI dashboard with percentage stats, bar charts, and flow diagrams in red, blue, and orange representing data trends.
    Add to Wishlist
    Download
    AI Customize
    KPI dashboard slide displaying supplier metrics with colorful pie charts, bar graphs, and a process flow with percentages.
    Free
    Add to Wishlist
    Download
    AI Customize
     KPI dashboard featuring colorful graphs, sales metrics, real estate charts, and visitor statistics, in a grid layout.
    Free
    Add to Wishlist
    Download
    AI Customize
    Slide with multiple dashboard elements including bar charts, line charts, pie charts, and progress meters in various colors.
    Free
    Add to Wishlist
    Download
    AI Customize
    KPI PowerPoint slide with line, bar, pie, and horizontal bar charts, each showing different business data metrics.
    Free
    Add to Wishlist
    Download
    AI Customize
    Multi-color pie chart slide deck showing data segments in various shades, each section labelled for visual comparison.