Best World In A Single Chart PPT Template PowerPoint

Circular chart with seven pastel colored segments, each with  icons and captions around it.
P.ID : 55586
    259 views
    45 Downloads
    Get Custom Slides by Experts
    Instantly Access Templates in PowerPoint

    Best World In A Single Chart PowerPoint Presentation

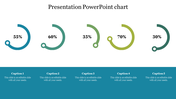
    Try out these World In A Single Chart PPT Template to have the ability to reach out to informative presentations. Create an inspiring presentation with this single chart design in your business. 100% editable & customizable presentation.

    About the Template:

    World In A Single Chart PPT Template Slide helps display single-value data and is widely used in dashboards. This template is perfect for presenting your future global goals to enlighten them. You can display about the economy, population, global business, etc. In addition, you can add more motivating quotes and images to inspire an unexpected change. The template holds seven segments to examine the shares of various countries. Choose this template if you want to be more successful.

    Features of the Template:

    • Innovative slide background designs
    • 100% easy to edit and customize slides
    • The slide contained 16:9 and 4:3 format.
    • Easy to change the slide colors quickly.
    • The elegant look of this template will give life to your presentation.
    • Crisp and clear font styles.
    • Fantastic slide template.
    Advertisement

    You May Also Like These PowerPoint Templates

    Add to Wishlist
    Download
    AI Customize
    Clustered bar chart comparing data across quarters with horizontal bars in various colors.
    Add to Wishlist
    Download
    AI Customize
    Slide with three vertical boxes in blue, red, and green banners, and rounded icons labeled K, W, and L for learning stages.
    Add to Wishlist
    Download
    AI Customize
    PowerPoint chart template showing stacked bar graphs with different categories and values for each year from 2016 to 2019.
    Add to Wishlist
    Download
    AI Customize
    Line graph infographic showing data from 2015 to 2020, with three colored lines in purple, yellow, and green, and text.
    Add to Wishlist
    Download
    AI Customize
    Donut chart in blue and orange displaying percentage, with matching colored caption boxes on either side.
    Add to Wishlist
    Download
    AI Customize
    Our Predesigned Chart Templates PPT Slides Designs
    Add to Wishlist
    Download
    AI Customize
    KWL chart slide with three columns in blue, red, and gold, representing learning insights.
    Add to Wishlist
    Download
    AI Customize
    Infographic with four bar graphs, each showing data points A to D, and captions areas in green boxes.
    Free
    Add to Wishlist
    Download
    AI Customize
    PowerPoint presentation slide featuring a stacked bar chart, aerial landscape photo, and a comparison table of drone data.
    Free
    Add to Wishlist
    Download
    AI Customize
    PowerPoint slide with a circular pie chart showing four segments labeled with percentages and a placeholder text.
    Add to Wishlist
    Download
    AI Customize
    Customized Kubler Ross PowerPoint Presentation Template
    Add to Wishlist
    Download
    AI Customize
    Visual of boost engagement growth with stacked bar categories: newsletter sign-ups, premium customers, and followers.
    Add to Wishlist
    Download
    AI Customize
    Pie charts showing data percentages for growth, with three percentage values with placeholder text.
    Free
    Add to Wishlist
    Download
    AI Customize
    Chart infographic with four drop shaped gauge style meters in blue, green, yellow, and red, each with text below.
    Add to Wishlist
    Download
    AI Customize
    Dual chart template slide with scatter and bubble charts, the scatter chart on the left and the bubble chart on the right.
    Free
    Add to Wishlist
    Download
    AI Customize
    Slide with green and white sections, featuring pie and bar charts, and an engine image in the bottom right corner.
    Add to Wishlist
    Download
    AI Customize
    Chart with five blue vertical bars showing percentages, paired with captions, on a white background.
    Free
    Add to Wishlist
    Download
    AI Customize
    Infographic with a circular segmented chart in blue shades, centered around an AI head graphic placed in white background.